

Table of Contents
Introduction
In 1990, states began allowing students to attend private school at public expense. Most of the early initiatives were small and confined to students who were low-income, had special needs, or attended low-performing public schools. Over the past three years, the scope of these programs has expanded significantly: a decades-long campaign by school-choice proponents found a receptive audience in parents frustrated with public schooling during the pandemic, resulting in a striking expansion of private school choice and a dramatic rethinking of which students should be able to participate.
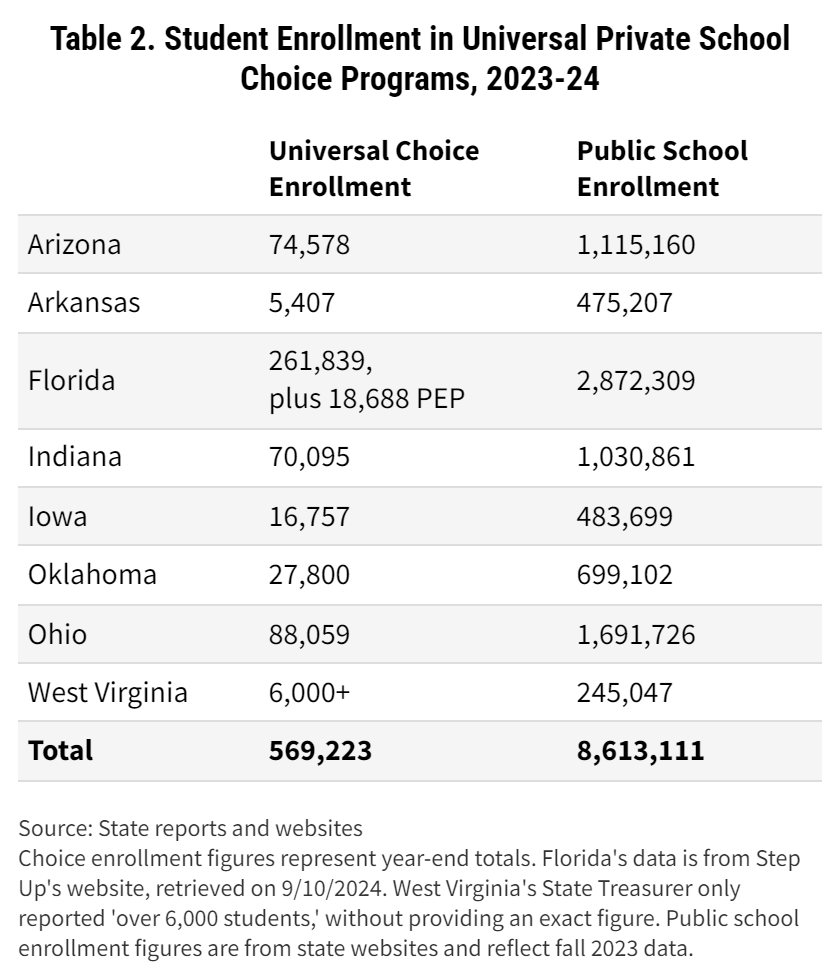
Today, of the 33 states with private school choice programs, 12 have laws allowing any student, regardless of income or need, to apply for government funding to subsidize their private, religious, or, in some cases, homeschool education. We have calculated that 569,000 students received public subsidies for private schooling in 2023-24 under universal programs in the eight states where the programs were up and running, representing 55 percent of the students attending private school with public funding that year, at a cost to taxpayers of about $4 billion. With the introduction of the new programs, 40 percent of the nation’s 50 million elementary and secondary students are now eligible for public subsidies.
Never in the history of American public education has so much money been available to parents to pay for private school tuition or homeschool expenses. And universal private school choice appears set to expand further. Enrollment continues to increase where programs are offered, and states including Texas and Mississippi have universal private school proposals on the legislative docket. Advocacy organizations continue to push expansion aggressively.
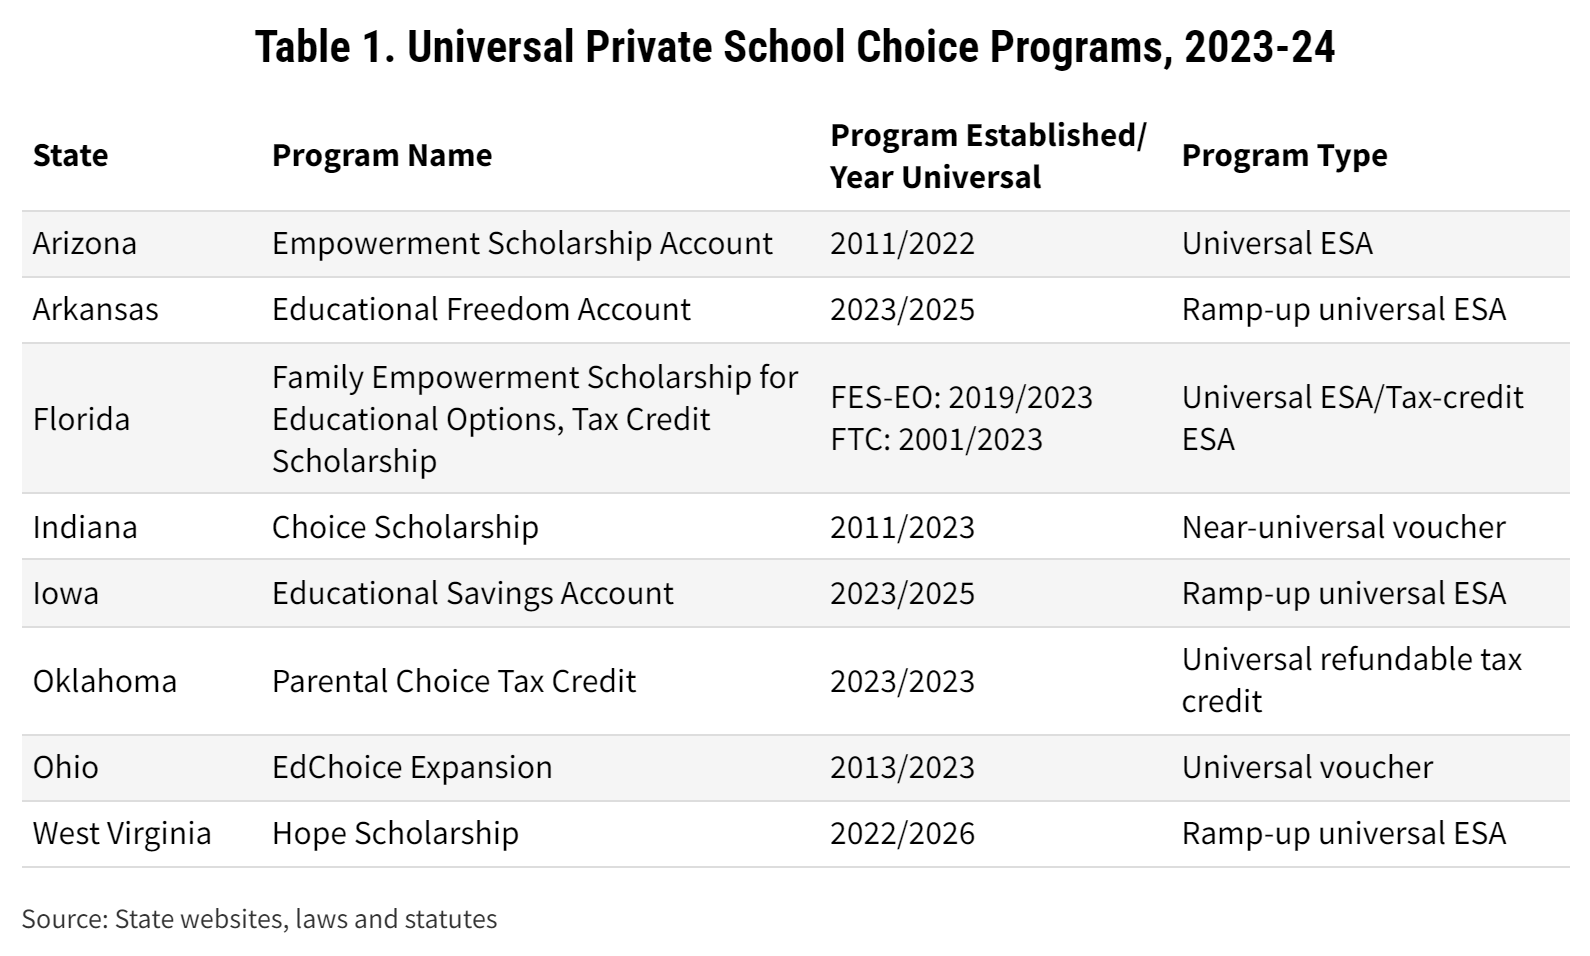
To help policymakers, educators, parents, and taxpayers understand the implications of the rapid rise of universal school choice programs, FutureEd examined the evolution of established or emerging programs during the 2023-24 school year—the first year to provide a comprehensive picture of universal choice—in Arizona, Arkansas, Florida, Iowa, Indiana, Ohio, Oklahoma, and West Virginia. We explore the contours of the new universal choice landscape, their potential consequences for the delivery of elementary and secondary education, and the universal choice movement’s emerging impact on the nation’s commitment to educational equity. We also gathered early insights from programs launching in North Carolina and Utah this year, as well as programs in Alabama and Louisiana launching in 2025-26.
We found that while the programs share a commitment to providing every student with public funds for private schooling, they vary significantly in their design. Some states help families navigate their options by providing information about the performance of private schools; others are more hands-off. Some states impose budget or enrollment caps, prioritize funding based on need, or provide more dollars to lower-income families; others, like Florida and Arizona, fund all applicants irrespective of family means, without caps on the number of participating students or the amount awarded. Some states track student performance under the programs; others do not.
These policy differences have important consequences for state spending, school quality, student learning, educational equity, and taxpayer protections, we found. All the states fund families through tuition vouchers, education savings accounts, or scholarships paid for by individual and corporate donors in exchange for state tax credits. Yet funding for the 2023-24 program year did not always roll out in predictable ways: certain programs have proven more expensive than anticipated by proponents, drawing down state coffers if not state education budgets directly. The primary beneficiaries of some programs have been affluent families with students already enrolled in private schools. Princeton University researchers have found evidence of Iowa private and parochial schools raising tuition to take advantage of state subsidies, which may make it harder for lower-income families to participate in the programs. It’s not possible to know how much students are learning under some of the programs.
Our portrait of the universal private school choice movement in 2023-24 suggests that it’s likely to present state policymakers with difficult decisions about the size and shape of the new choice plans—given their emerging impact on state budgets, public school funding and enrollments, longstanding efforts to strengthen educational opportunities for low-income students, and even the sustainability of public charter schools.
Which Children Do These Programs Serve?
While in theory all students can participate in universal choice programs, in practice access and participation vary across states. Some of this depends on how states define “universal”; that is, whether the programs are designed to accommodate all students, or if “universal” refers only to eligibility—meaning all students can apply, but not all may receive funding. In some instances, the limiting of funding is intended to increase opportunities for low-income students, allowing all to apply but targeting resources at the neediest applicants.
Arkansas, Iowa, and West Virginia are phasing in their universal choice programs and haven’t yet reached all-student eligibility. Oklahoma and Arkansas have capped the number of participating students. In Florida and Arizona, in contrast, no student who applies for funding is turned away. Though that doesn’t guarantee students a place in a school of their choice; application requirements and the availability of private school seats ultimately influences who participates in the states’ universal programs.
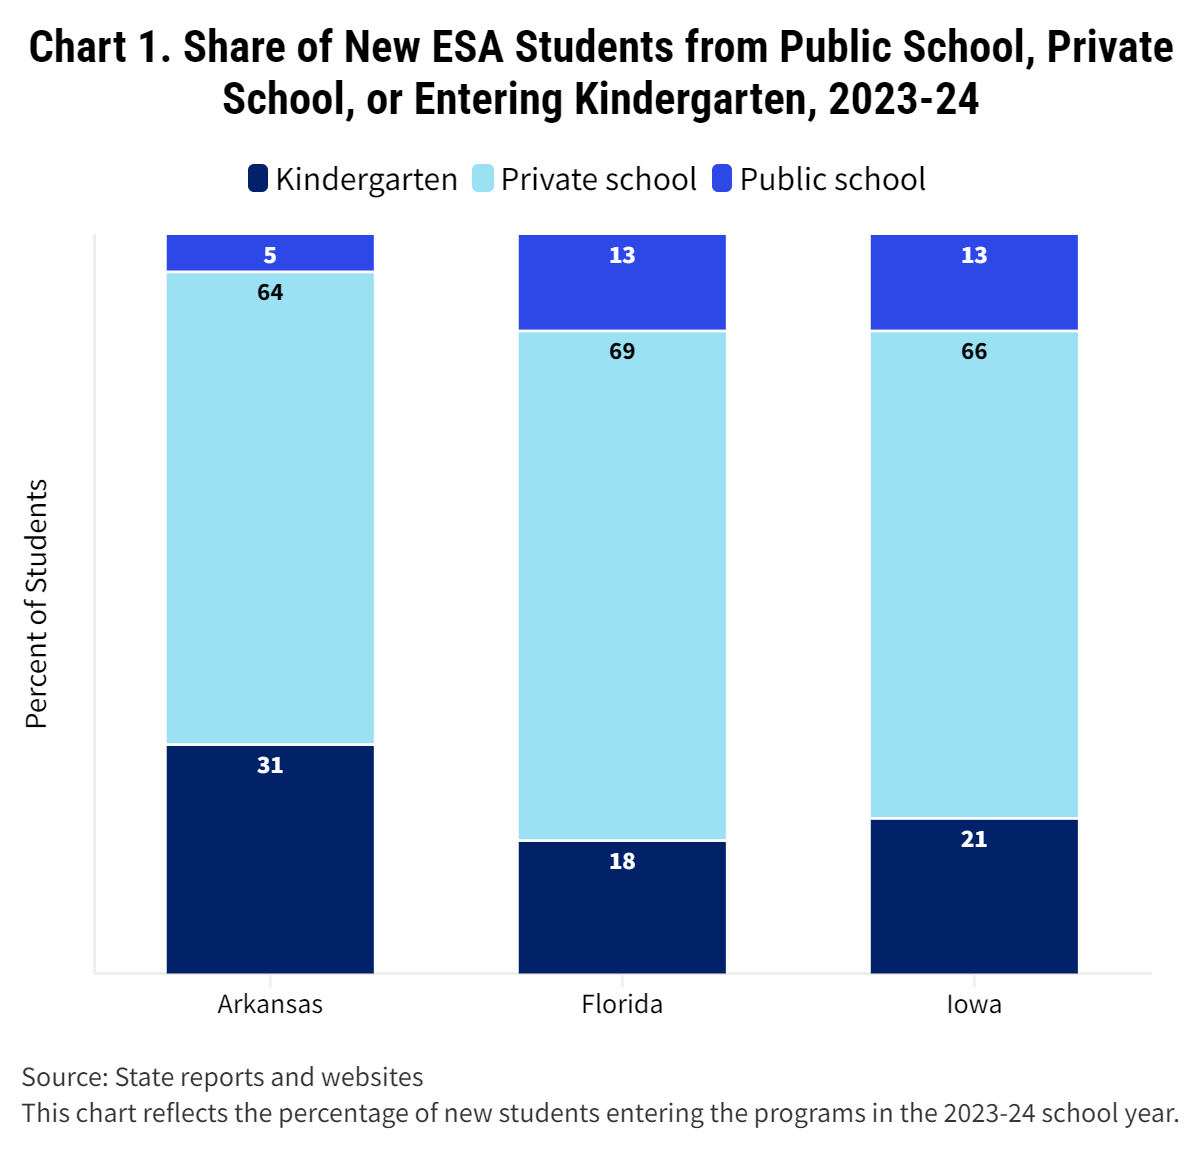
Rather than driving a broad shift in enrollment from public to private education, universal choice programs have initially served primarily children already enrolled in private schools. In Arkansas, for example, 64 percent of students who received funds through the state’s Education Freedom Account (EFA) for the 2023-24 school year—the first year of the program’s implementation—were already enrolled in private schools. Most of them were students with disabilities. Although the Arkansas program targeted students attending low-performing public schools, kindergarteners, and student with disabilities in 2023-24, only 5 percent of recipients transferred from public schools, and a mere 55 of the more than 28,300 students in the state’s 79 F-rated public schools participated.1
Similarly, 66 percent of 2023-24 Educational Savings Account (ESA) recipients in Iowa already attended private school, while only 13 percent transitioned from public schools—a notable imbalance considering the program is open to all public-school students but only accepts private-school students from households earning 300 percent of the federal poverty level or less.
In most states, lawmakers had anticipated a much higher public-to-private transfer rate. In Iowa, they projected that more than one-third of the expected 14,000 ESA participants would come from public schools. The actual number was less than half that. In Arizona, despite concerns that private schools might initially face capacity issues, lawmakers predicted that more than 36,000 public school students would switch in the 2022-23 school year. The actual number was closer to 6,000.
Why have fewer public-school students than expected made the switch? Were families reluctant to choose private schools? Unaware of the opportunity? Unable to secure placements despite their interest and eligibility?
Data from Iowa indicates that public-school families were aware of and initially interested in the ESA program. According to a July 2023 press release from the office of Governor Kim Reynolds, 40 percent of approved applicants for the 2023-24 school year were public-school students intending to switch to private schools—markedly more than the 13 percent, or 2,135 students, who ultimately transferred.2 The Governor’s office had indicated after the application period had closed that approximately 9,000 private-school seats were available statewide, which should have been enough to cover those who wanted to switch, though those openings may not have been geographically accessible to families or in their preferred schools. Also, private schools have the right to reject applicants; funding does not guarantee admission. Arizona’s implementation of its Empowerment Scholarship Account (ESA) program does suggest that public school students’ participation rates rise in subsequent years. In 2022-23, the first year of universal eligibility, 21 percent of ESA recipients in grades 1-12, or 6,157 students, previously attended public school; a year later, the figure increased to 48 percent, or 9,250 students.
It is too early in the evolution of the universal choice plans to know if the number of private schools would expand in the event of demand outstripping the current supply of private schools. Choice advocates express confidence that the marketplace would produce more private educational providers, though the cost and complexity of creating high-quality schools from scratch have proven daunting challenges in both the independent school and charter school sectors. The $7,000 to $8,000 that states typically provide students annually under the new universal programs isn’t likely to be enough to support the launching of new schools in many parts of the country.
Arizona allows families to draw on the state’s new universal education savings accounts to cover a wide range of educational expenses, including tutoring, summer camps, computers, and field trips, resources available statewide. But the majority of the private schools participating in the new universal choice programs are urban and suburban.
In Arkansas, which requires private schools receiving public money be accredited, most participants are concentrated in urban areas where private schools are more abundant: 59 percent from the central region, around Little Rock, and another 16 percent from around Fayetteville to the northwest. Students are even further concentrated in a subset of schools, with 10 of the 94 participating schools enrolling nearly 40 percent of all students. All but one are religiously affiliated, and the five schools with the highest enrollment are ranked among the top-performing private schools in the state by the school-rating service Niche. Next year, the program will expand to homeschoolers. In Indiana, where 90 percent or more of students in 178 private schools are attending with public funding, the 357 schools accepting public monies are similarly concentrated in metropolitan and suburban areas.
Interestingly, in Indiana most students who attend private schools do so within the boundaries of their local public school system. This may be due to the state’s relatively large number of participating private schools or a preference for geographical convenience. The school choice advocacy organization EdChoice reported in its 2024 Schooling in America Parent Survey that 19 percent of parents ranked proximity to home as one of their top-three reasons for selecting their children’s private schools. A larger percentage of parents cited academic quality, safe environment, and morals/character instruction as their top reasons for selecting private schools.
The lack of available options in rural areas has contributed to many rural Texas lawmakers opposing a universal private school choice program that Governor Greg Abbott has sought for several years.
Participation by income
Private school choice programs predominantly serve lower- and middle-income households. But we found that participation among higher-income families increased in 2023-24 in every state where eligibility expanded and income information was available.
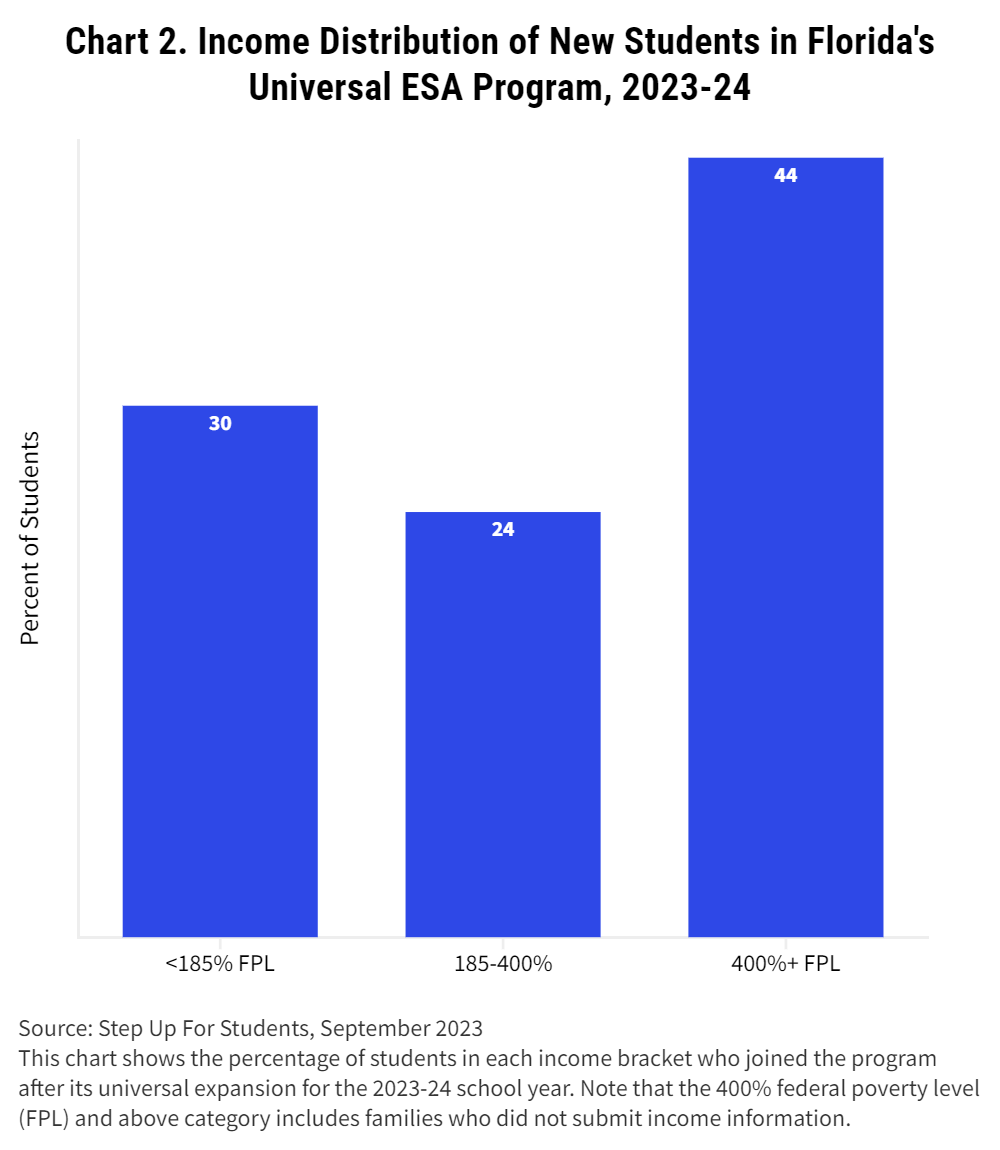
In Florida, families previously ineligible under income restrictions flocked to the program when it expanded in 2023-24 to include all families in the state. Nearly half of the state’s new ESA recipients came from families earning over 400 percent of the federal poverty level (about $125,000 for a family of four), while a third came from families eligible for free or reduced lunch.3
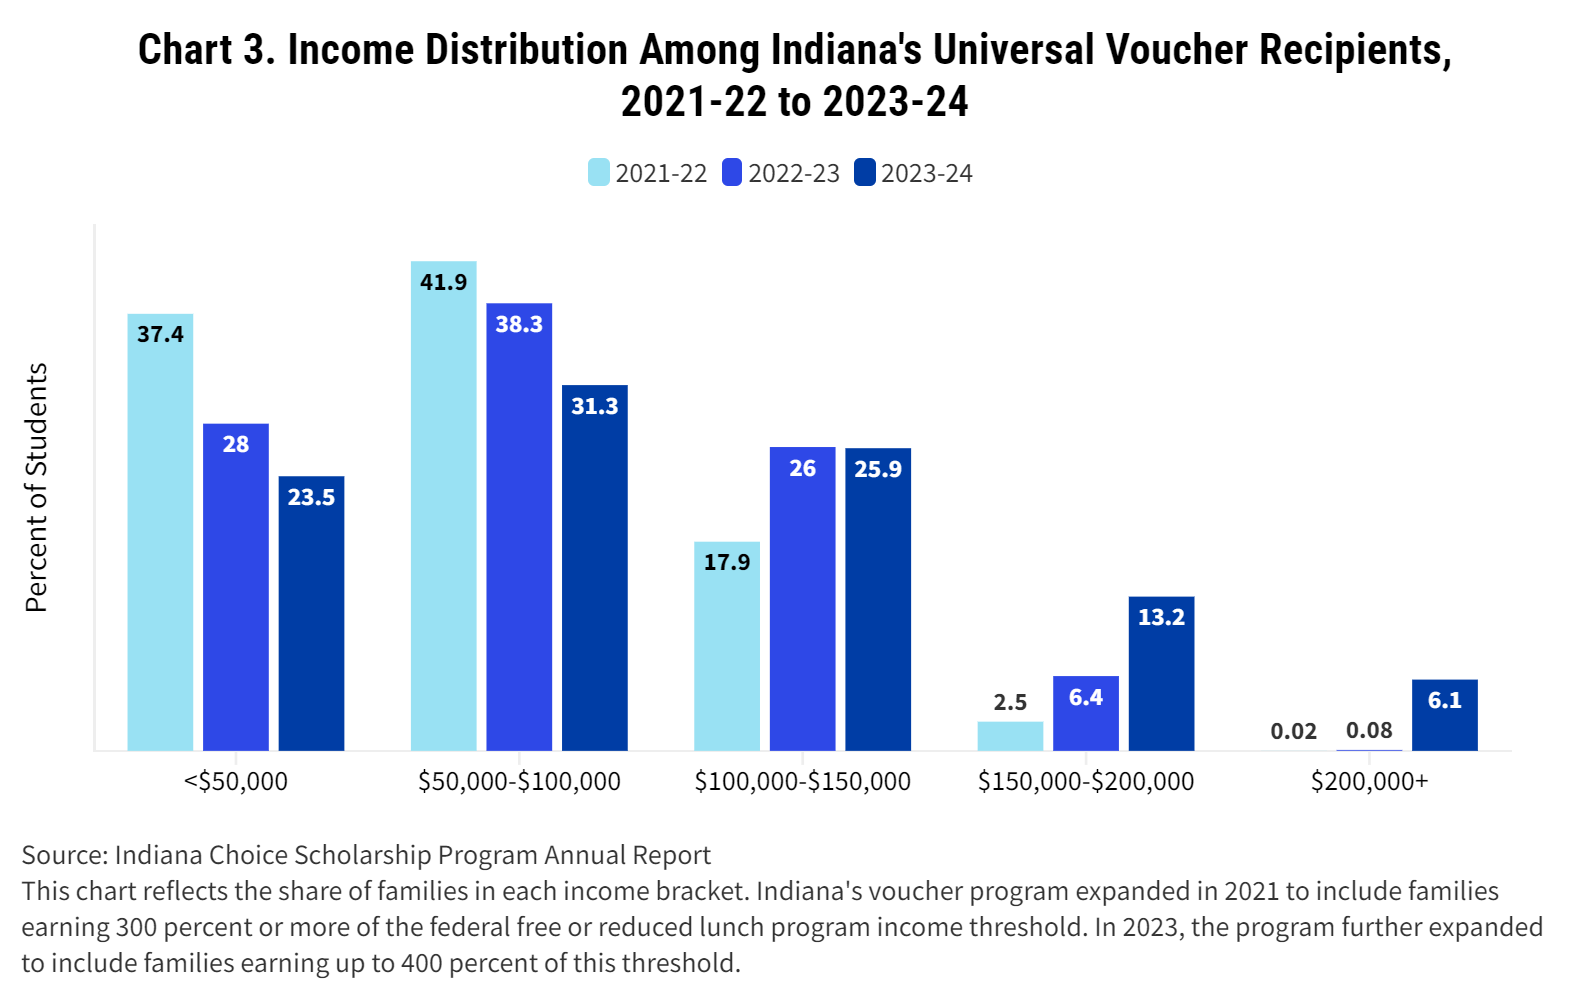
Indiana’s share of higher-income families also grew, with 6 percent of ESA recipients living in households earning more than $200,000, and 55 percent earning less than $100,000. Before the program’s expansion, the figures were 1 percent and 66 percent. [See Charts 2 and 3]
In Ohio, 67 percent of families in the state’s universal private school choice program were low-income before the program was expanded to include all families. After the expansion, the figure dropped to 17 percent, in 2023-24. Ohio requires private schools to accept vouchers as full tuition for families with incomes at or below 200 percent of the federal poverty level, or $62,400 a year for a family of four. The state does not report information on the incomes of families in the program above that threshold.
Some states prioritize applicants by income level, directing dollars primarily to lower- and middle-income families. Utah’s new universal ESA program, launching this school year, preferences students from families with incomes at or below 200 percent of the poverty line ($62,400 for a family of four). Due to high demand and limited seats, all students awarded ESAs to date fall within that income group.4 Similarly, Oklahoma’s refundable tax-credit program prioritizes families earning less than $150,000 per year, with about three-fifths of students coming from that group in 2023-24. About $101 million of the $150 million in tax-credits went to the priority applicants.
North Carolina’s voucher program, open to all families for the first time this school year, originally prioritized applicants by income-based tiers, from those qualifying for free and reduced lunch to those at or above 450 percent of that threshold, about $260,000 for a family of four. And because the number of applicants for 2024-25 far exceeded available funding, the state planned to exclude students from higher-income families. As a result, most students initially receiving vouchers earned less than $57,700. But in September 2024, days into the new school year, the state legislature approved funding to clear the program’s 55,000-student waitlist, including some 13,000 students from families earning $260,000 or more.
Participation by race and ethnicity
While only Ohio and Indiana currently make racial and ethnic data available on private school choice participation across years, there has been an increase in the participation of white students in those states as eligibility has expanded.5
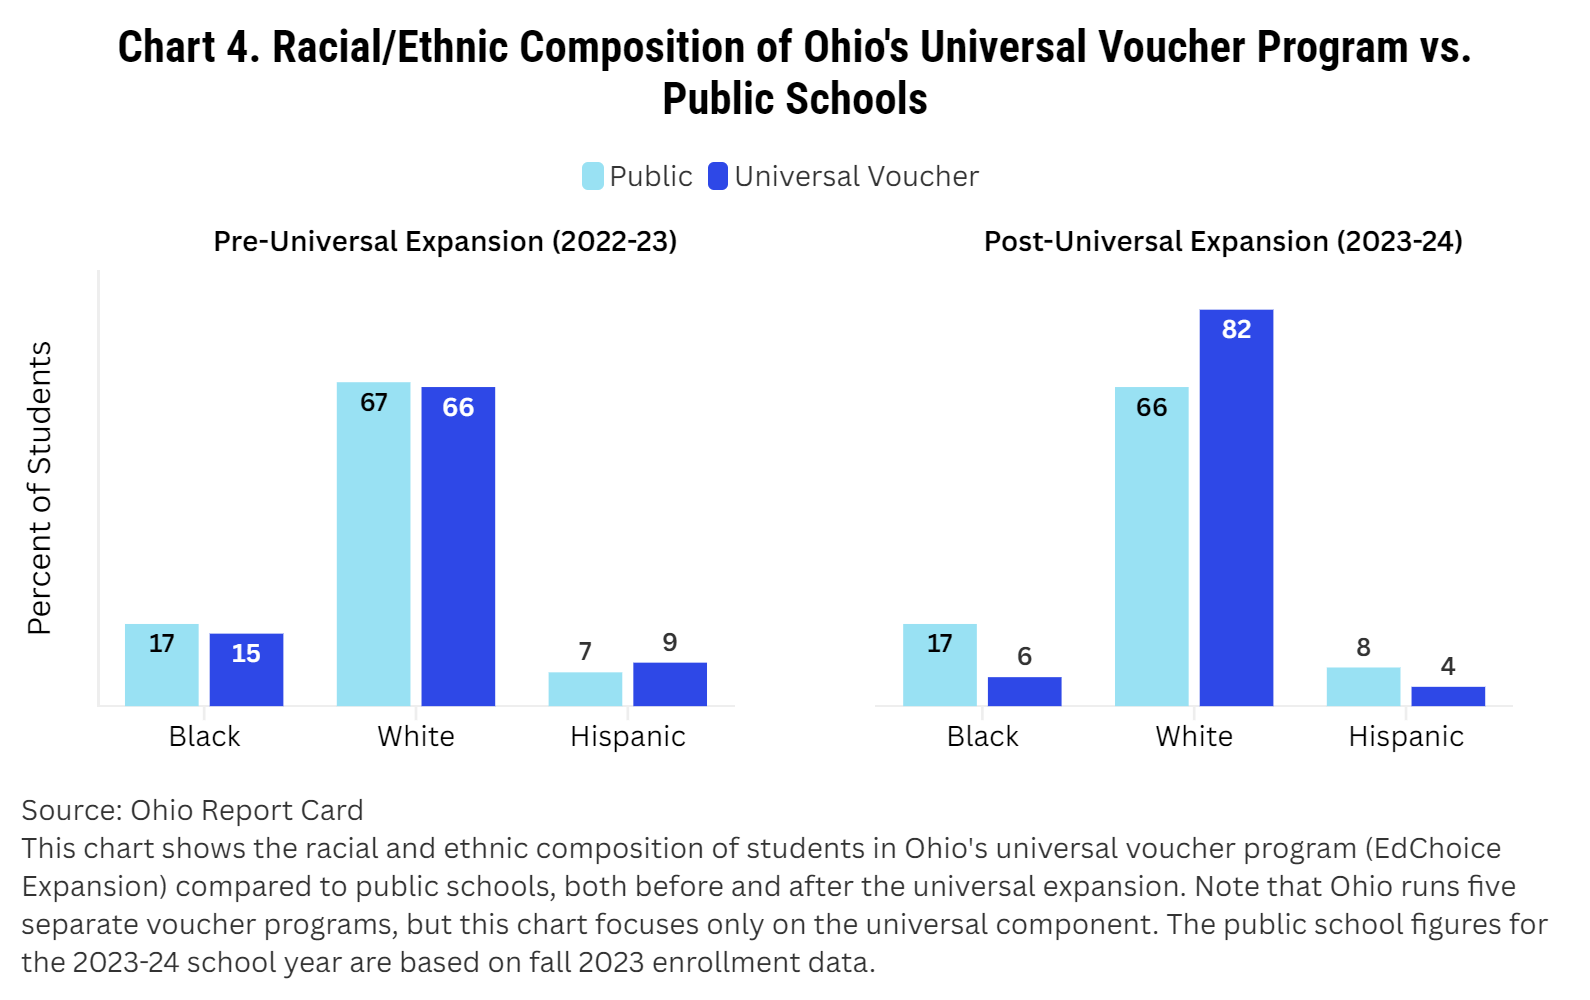
In Ohio, the share of white students receiving public funding for private schooling in the universal program (EdChoice Expansion) increased from 66 percent to 82 percent after the program’s expansion, with almost 90 percent of new participants identifying as white, while the percentages of Black and Hispanic students decreased. Prior to the expansion, the racial makeup of students in the EdChoice Expansion program more closely mirrored the composition of public-school students.6
In Indiana, the proportion of white students also increased but much less than in Ohio, growing from 62 percent to 64 percent after the program expanded. There were slight declines in Hispanic and Black student participation. In 2023-24, Black students made up 9 percent of choice students and 13 percent of public-school students.
Participation by grade level
Grade-level data reveals that kindergarten students have typically shown the highest rates of participation in the newly established universal programs. The availability of private school seats is also likely highest in kindergarten. In Iowa and Arkansas respectively, 21 and 31 percent of ESA recipients were entering kindergarten. Indiana saw its kindergarten enrollment more than double after expansion, and Arizona experienced an eightfold increase in ESA participation among kindergartners immediately after expansion.
While we can’t say how many families would have enrolled their kindergarteners in private school without ESA funds, it is reasonable to suggest more families in these states are opting for private education from an early stage as a result of universal eligibility.
How Do Universal Programs Impact State and Local Budgets?
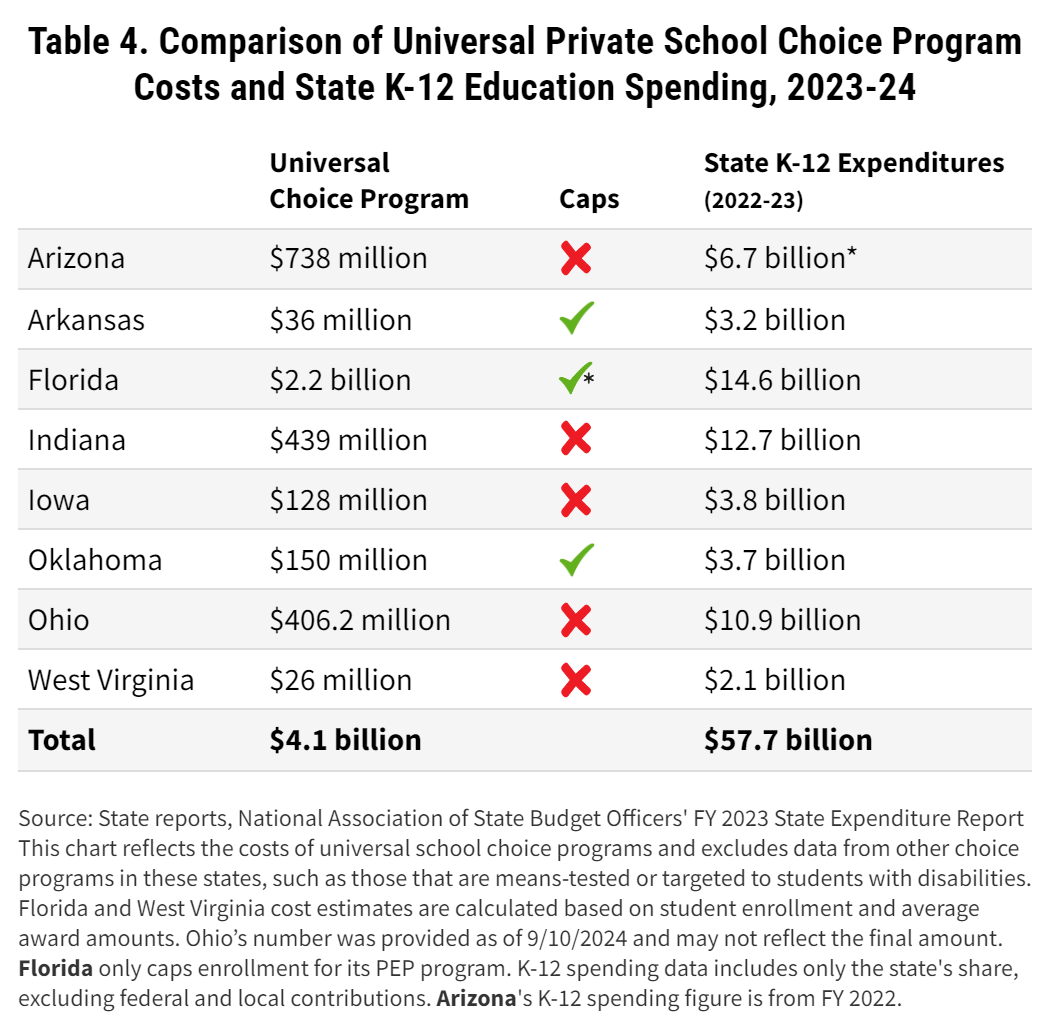
Prior to the pandemic and an unprecedented $189 billion infusion of federal Covid-response funding, public education received some 45 percent of its funding from local taxes, 47 percent from state revenues, and 8 percent from the federal government. The combined $4 billion in tax credits, education funds, and general revenue expenditures supporting students in universal private school choice plans in 2023-24 was funded with state monies and is the equivalent of about 7 percent of overall state education spending in the eight states we studied. In 2022-23, they spent nearly $58 billion on K-12 education from state sources.
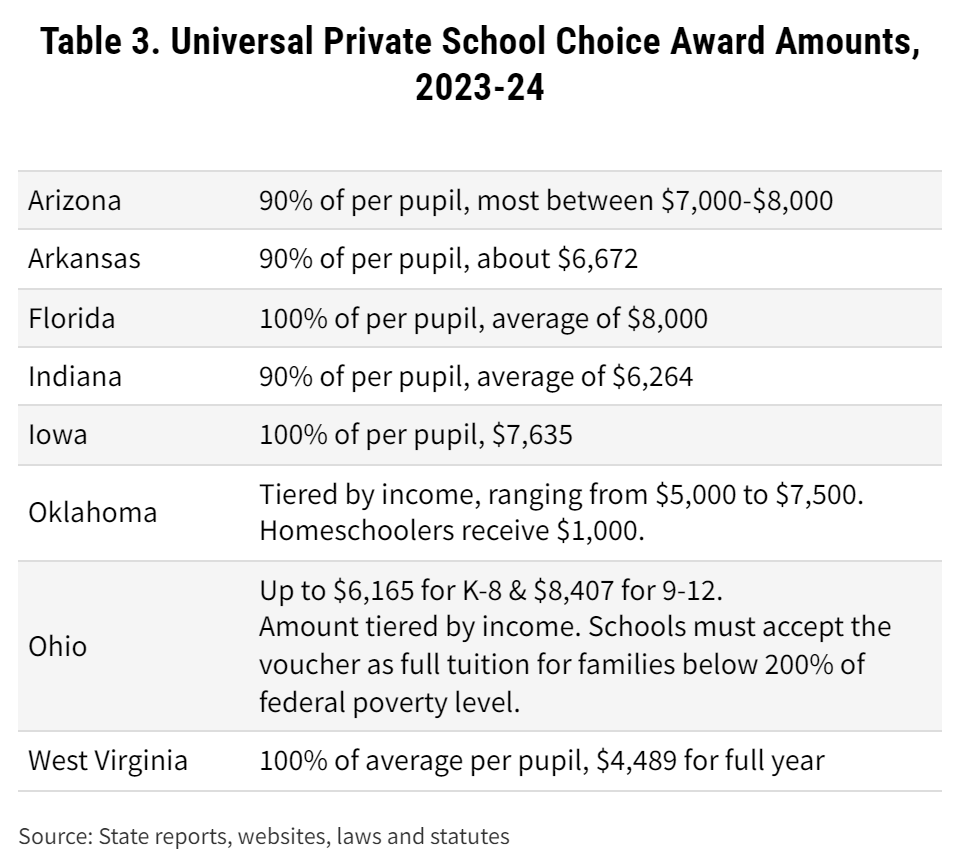
In states where private school choice providers receive state education aid, they typically get the equivalent of about 90 percent of a state’s per-pupil funding of public schools and the funding that public schools receive from local property taxes does not follow students to private schools.
Some of the public funding for the new universal choice programs comes from state coffers but not state K-12 education budgets. Oklahoma, for instance, funds its program through tax credits that permit parents to recover the cost of private schooling even if they don’t owe taxes—making the tax credits comparable to vouchers. The program reduces state tax collections but doesn’t directly affect educational appropriations or school funding formulas. Alabama’s ESA program, set to begin in 2025-26, will be funded similarly.
Several universal school choice programs provide only a portion of the per-pupil funding states give to school districts. Arkansas, for example, provides parents 90 percent of its per-pupil funding, around $6,700. If a student leaves a public school district, the money goes to the parent and the district loses the funding, though the state saves 10 percent of what it was paying the school district. If the student was already in private school, public schools lose no money, but the state incurs a new expense of $6,700. Iowa, on the other hand, funds its ESA program at 100 percent of its per-pupil distribution to school districts: $7,635.
Some states have capped participation and set budget ceilings to manage expenditures under their new universal programs. Utah’s budget cap of $82.5 million limits participation to 10,000 students annually. Had the state funded all of its 27,000-plus 2024-25 applicants, the price tag would have exceeded $218 million.
But other states, including Arizona and Florida, allow any student who wants a scholarship to receive funding, prompting growing concern about their rising cost trajectories and potential to commandeer an increasing larger share of state education spending. Elementary and secondary education is already one of the largest expenditures in state budgets.
Arizona lawmakers projected that the addition of universal eligibility to the state’s private school choice program would cost $33 million in 2022-23, its first year, and $64 million in 2023-24—estimates driven primarily by the anticipated participation of existing private school and homeschool students. But the number of those students seeking ESAs surpassed expectations, increasing the cost of their participation to at least $160 million in 2022-23 and another $71 million in 2023-24.7 In all, nearly 75,000 Arizona students had been funded by the end of the 2023-24 school year, at a cost of just over $738 million. (The office of Governor Katie Hobbs, a democrat elected after passage of the universal program and an opponent of public funding of private schooling, had predicted in July 2023 that the program could cost upwards of $940 million by the end of the 2023-34 school year.)
Some of Arizona’s high costs are driven by the roughly 18 percent of ESA students with disabilities. Of the 13,000 scholarships awarded to these students, nearly 6,700 exceeded $30,000, reflecting the high price of private placements for such students. Other states, including Florida, fund students with disabilities through a separate program.
In a second example of spiraling costs, Iowa initially budgeted $107 million for its universal program in fiscal year 2024, expecting 14,000 participants. It then approved $144 million for some 19,000 applicants, though 2,000 of those students ultimately didn’t participate in the state’s private school choice program, reducing the state’s cost to $128 million. The state doesn’t survey students to understand why they apply for private school funding but remain in public schools.
The cost-overruns stem in large part from lawmakers’ underestimation of the predictable enthusiasm for the new subsidies among families already paying private school tuition. In Iowa, for example, lawmakers projected about 6,000 existing private school students would use the state’s ESA for the 2023-24 school year; the actual number exceeded 11,100.
Only in Arkansas did availability in a universal program exceed applications. The state capped participation at 7,000 students in the EFA’s first year yet wound up funding roughly 5,400 students and coming in under its budget of $46.7 million. Litigation over whether the program violates the Arkansas state constitution delayed the program’s start to June 2023 and may have deterred some potential applicants. But this shortfall appears to have been a one-time event: the state has reached its cap of approximately 14,000 students for the 2024-25 school year.
Florida, a large state with no caps on enrollment in its universal program, has the nation’s largest and most expensive universal choice initiative, costing upwards of $2 billion in 2023-24. About half the money came from the Florida Education Finance Program, which provided the state’s schools $27 billion in 2023-24. The other $1 billion was funded from money donated to the private school choice program by individuals and corporations in return for tax credits. The state uses these funds to pay students for private schooling and home schooling before tapping the state education budget. Florida also set aside supplementary funds to cover potential cost overruns, though it remains unclear whether reserves were needed last year.
While public schools are not yet losing large numbers of students to the private sector under the new universal choice programs (the 569,000 students in the programs last year represent about 7 percent of the 8.6 million public school students in the eight states we studied), opponents argue that the increased state education funds needed to support the programs could be better used to enhance public education.
The effect on individual school district budgets varies greatly. In Iowa, about 20 percent of the state’s school districts lost no students, but some 12 percent lost more than 100 students. Iowa offset the potential impact on district budgets by providing districts with approximately $1,200 per ESA student. In Arizona, where the majority of ESA participants already attend private school, most districts have seen minimal impact on enrollment. Just 1,150 students have left Mesa Unified District outside of Phoenix since 2017 to join the ESA program, less than 2 percent of its student population. Nearby Tempe Union High School District lost 53 students in the same period, or less than .5 percent of enrollment.
Affluent school districts like Scottsdale Unified don’t lose state funding when their students use ESAs because they generate enough education revenue through local property taxes to disqualify them from state funding. The loss of significant numbers of students from school systems in communities that struggle to raise property taxes, on the other hand, could be damaging. And the migration to private providers could compound the financial consequences of declining enrollments from lower birthrates and other reasons.
Arizona’s Republican legislative leaders have maintained that the state is spending substantially less on students in the state’s universal choice program than if they were in public schools. Others, including an independent school finance expert in the state, say those claims are false. And Arizona’s legislature added $600 million in discretionary funding for public schools in the 2023-24 school year, which analysts at the pro-private-school-choice Goldwater Institute suggest was a way to keep district budgets “whole” in the face of the state’s expanded ESA program.
How is the Money Spent?
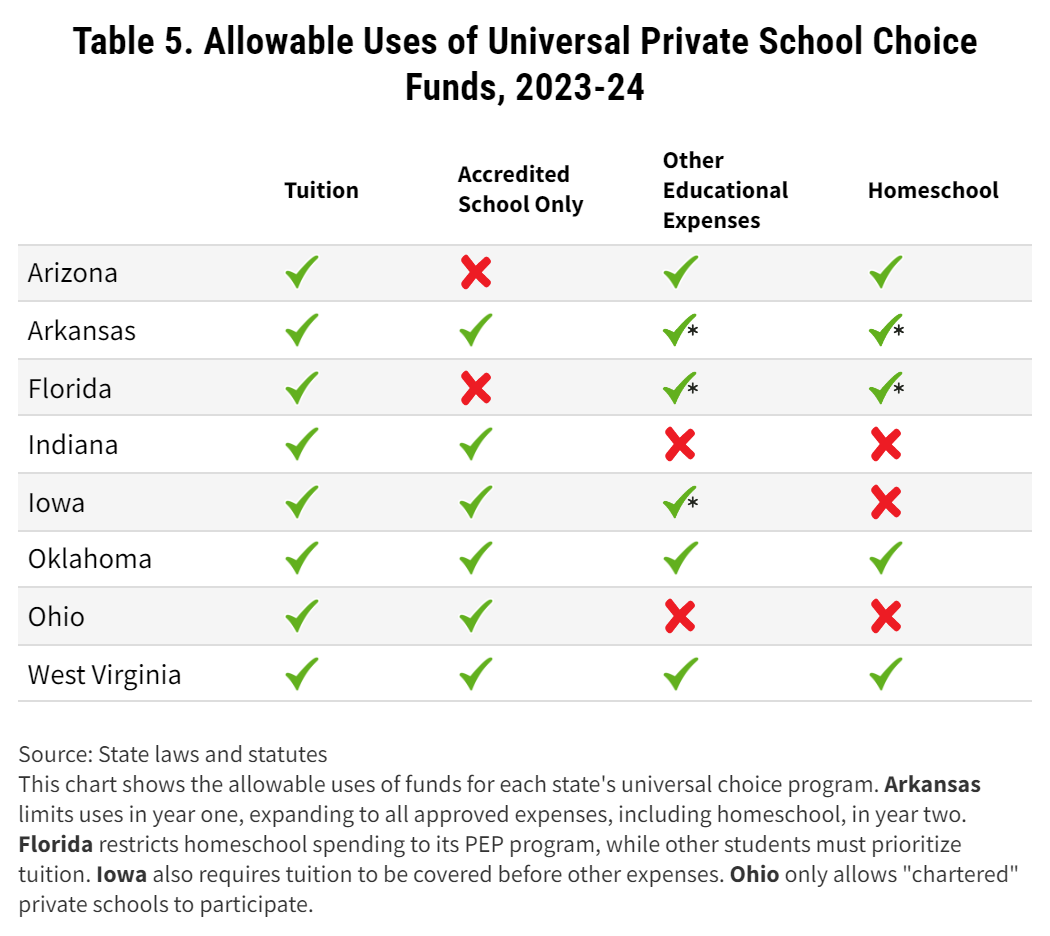
The states we studied distributed their shares of the $4 billion in universal choice funding in 2023-24 differently, and they allowed choice funds to be spent on different things. Some states channeled funds directly to schools and limited expenses to tuition and related charges. Others gave money to parents through third-party platforms like ClassWallet and allowed them to spend it on a wide range of educational expenses. In some states, homeschoolers may use ESA funds, while others require enrollment in private schools.
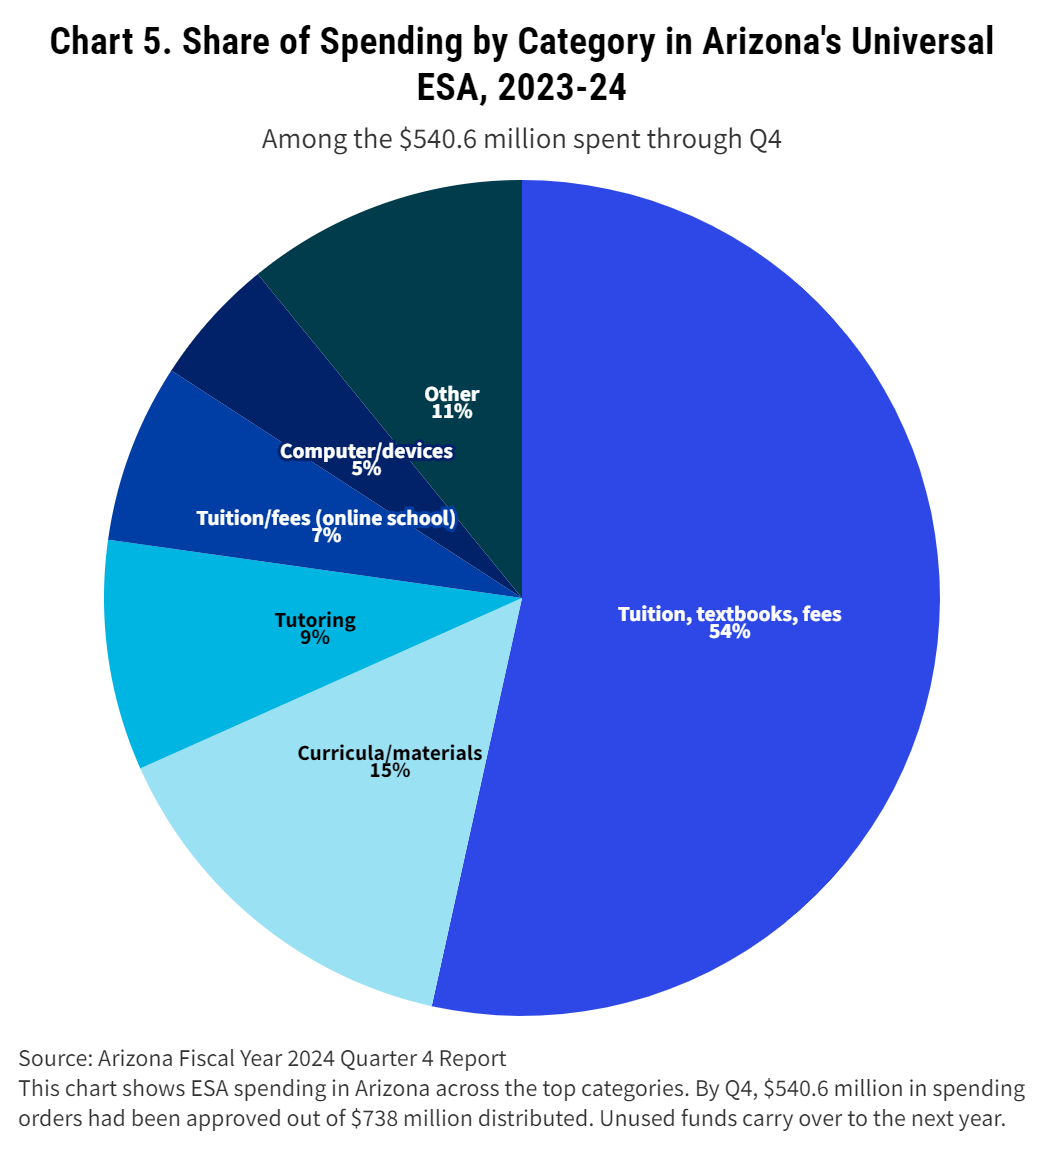
The majority of funds were used for tuition. Indiana and Ohio pay tuition directly to schools. Iowa mandates that ESA dollars be spent on tuition before other approved educational expenses, such as tutoring or textbooks. Arkansas restricts funds to tuition, supplies, uniforms, or other school-required expenses, and most are spent on tuition. Even in Arizona, the state that gives families the widest spending latitude, 85 percent of funds were spent on tuition, tutoring, curricular materials, or textbooks in 2023-24. [See Chart 5]
Many states narrow their spending requirements further, specifying which types of schools may participate in the programs.
Arkansas, Indiana, Iowa, Ohio, and Oklahoma require participating private schools to be fully accredited. Ohio only allows “chartered nonpublic” schools to participate in the state’s universal choice program, schools that comply with state graduation requirements and other regulations governing public schools. Ohio officials told us that most highly selective private schools in the state don’t participate in the programs because they don’t want to compromise their independence.
This school year, Arkansas joins the states that also permit students to receive services from non-traditional education providers like micro-schools, learning pods, and online schools—as long as the providers meet certain requirements. These include offering instruction in core subjects like math, reading, science, and social studies, administering student assessments, and ensuring that staff hold appropriate credentials. Part-time providers, such as tutoring services, are also required to have credentialed staff.
Arizona and Florida don’t require private schools participating in the states’ universal choice programs to be accredited. Florida requires most students to enroll in state-approved private schools. But accreditation isn’t part of the approval process. The state also includes a “homeschool” option within the universal program known as the Personalized Education Program (PEP). Unlike traditional homeschoolers, PEP students are registered with a scholarship-funding organization, and their parents must submit an annual learning plan to receive ESA dollars. Arizona has no requirements for homeschool families.
Some states, including Arkansas and Arizona, allow students participating in private school choice programs to take classes part-time at public schools, paying per-class rates. Perhaps surprisingly, given public educators’ widespread opposition to public funding of private schooling, the provisions have engendered public-private partnerships. In Arizona, about $3.2 million was spent on services, classes, and extracurricular activities provided by public schools to students in the state’s universal choice program in 2023-24.
West Virginia’s ESA program is notable for not requiring schools or service providers to be located within West Virginia, allowing students to enroll in out-of-state online programs or pursue educational opportunities in neighboring states. In 2022-23, the most recent year for which there’s data, 95 percent of the state’s universal choice funds were spent within West Virginia.
How Much are Students Learning?
A key question is whether the new universal choice programs work. The answer depends on whom you ask. Some advocates of private school choice are not focused on student outcomes, either for those receiving public dollars or those remaining in public schools. Instead, they prioritize parent satisfaction: the universal programs are successful if parents are pleased with the investments they make; schools and other private providers are successful if parents continue to choose them.
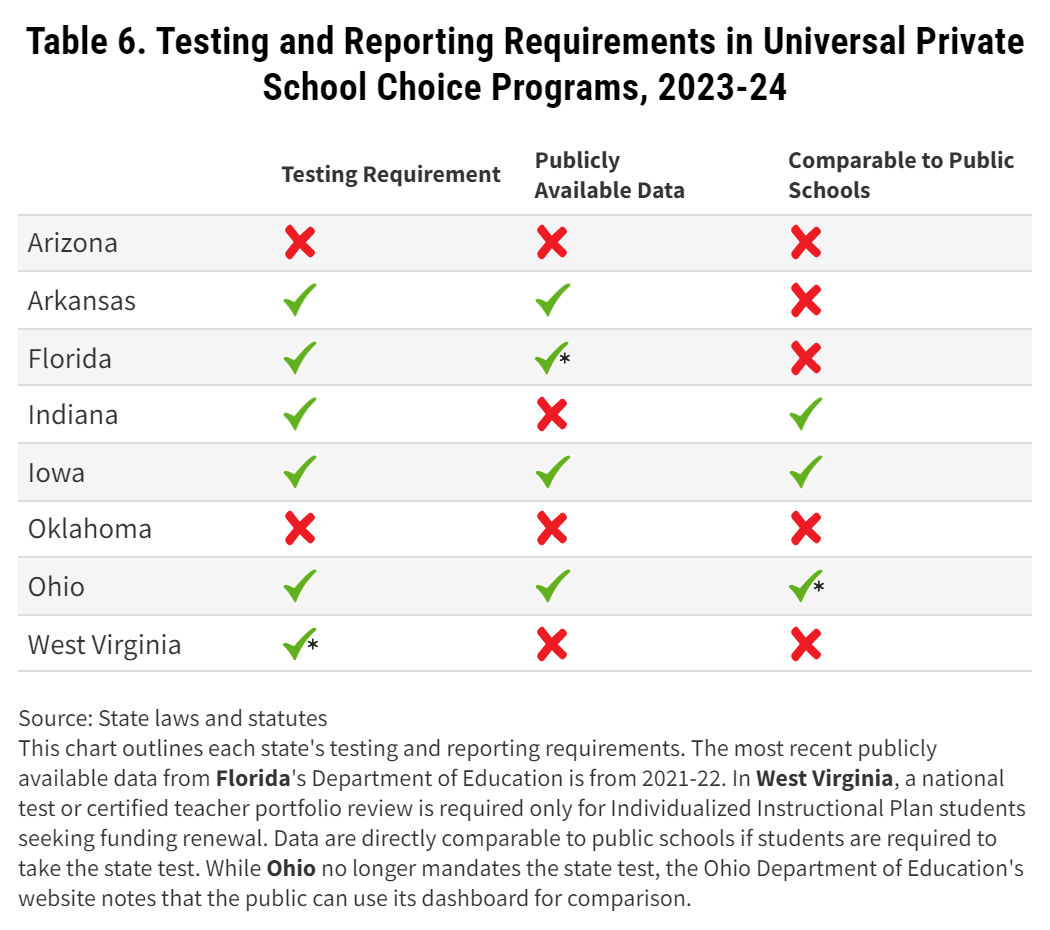
Nonetheless, every state with a universal private school choice program except Arizona and Oklahoma required academic assessments of participants in 2023-24. But some states allow multiple assessments, some don’t make the information public, and some don’t require results to be comparable to public school performance.
Iowa requires ESA recipients to take the same state-developed standardized tests as public school students, and it publicly shares data on student proficiency, academic progress, and graduation rates, broken down by demographic subgroups. Ohio, until 2019, required voucher students to take the state test but now permits the use of other approved assessments. But Ohio still maintains a dashboard that allows parents, policymakers, and the public to track voucher student performance. Indiana, on the other hand, does not publicize test scores from students in private schools but has long made data available to researchers on its private school choice program, which has existed in some form since 2014.
Performance comparisons aren’t possible in Arkansas and Florida because they let private providers use a variety of different tests. And even in states like Iowa and Indiana that require students attending private schools with public funding to take the states’ standardized tests, drawing comparisons from the results may be difficult. While public schools plan instruction based on state standards for each grade level, private schools in most states are under no such obligation. What fourth-grade public school students learn about math in Indiana may or may not be what fourth-grade private school students learn. A private school could save complex fractions for fifth grade, for instance, choosing to spend fourth grade going much deeper on angles and early geometric skills. If those students were to take a standardized test asking questions about fractions, their wrong answers wouldn’t reflect the quality of their education, but rather the pacing of curriculum across grades.
Moreover, of the eight states we studied only Ohio and Florida require schools in universal choice programs to share test scores with parents. The other states lack a framework to help parents decide what is working for their students—there’s no clear benchmark against which to measure student success.
School-based standardized testing and high school and college placement are common metrics used by even the most elite independent schools, though affluent parents have sent children to private schools for decades without needing state assessment data to know if they are happy with their child’s education. Perhaps parents already have what they need to evaluate their children’s progress. But the absence of performance information precludes the possibility of public accountability.
Arizona, the state with the most expansive eligibility requirements and allowable expenses among the new universal programs, provides fiscal transparency and accountability through a clearly articulated public process for reviewing families’ spending requests. In January 2024, State Superintendent of Education Tom Horne announced that ESA program administrators had rejected 12,200 out of the 252,000 requests in the previous quarter for failing to meet state guidelines. The state publishes quarterly public reports that detail usage, appeals, audits, and additional information.
But without standardized testing requirements or other performance metrics in Arizona and Oklahoma, it is nearly impossible to gauge how much learning is taking place under the state’s private school choice programs. That challenge is compounded by the fact that none of the states have clearly defined the purpose of the new universal programs, beyond the expansion of school choice. They could track the number of students leaving low-performing schools to participate in universal choice programs, or the number of low-income students enrolling in private schools. They could gauge the number of students taking part in the universal programs who enter college without needing remedial education, or the number of students entering the workforce in jobs that allow for economic mobility. But choice proponents have not articulated educational outcomes that they hope the new programs achieve.
As FutureEd has written previously, research on the academic effectiveness of private school choice programs is mixed. Early studies showed promising effects of smaller-scale programs on student achievement, but a majority of more recent studies of statewide programs have found negative academic results.
Among the states with universal choice programs, only Florida has mandated funding to evaluate student academic performance in its universal program. Florida State University has received $250,000 annually to analyze standardized test data from schools accepting Family Empowerment Scholarship or Tax-Credit Scholarship students. Its latest evaluations were published in June 2023 analyzing the 2021-22 school year. The evaluations include school-level performance data for schools with at least 30 scholarship students. Starting in the 2027-28 school year, students in the state’s Personalized Education Program (PEP) will also be required to take a test and report the results to the university. This requirement could limit participation in the program, as many homeschool families prefer to be free of public oversight.
Looking Ahead
Support for private school choice continues to build. The North Carolina legislature recently approved an additional $248 million to fund the 55,000 students on the state’s universal voucher waitlist. Alabama and Louisiana will soon roll out applications for ESA programs set to launch in 2025-26. Utah lawmakers are expected to push for a larger private school choice budget during the state’s 2025 legislative session. Indiana supporters are hoping to do away with income-based eligibility restrictions in the state’s universal program while permitting parents in the program to spend their public funds on more than tuition. Universal private school choice bills that failed in Texas, Tennessee, and Mississippi in 2024 are expected to be reintroduced next year, while ESA legislation will likely be introduced in Idaho for the first time.
How state leaders design these programs will have a powerful effect on which students participate in them, whether students benefit from the programs, the nature of the benefits, and the consequences for state budgets.
Arizona and Florida have shown that if a program is fully universal with no budget cap, parents currently paying for private school will readily pass their costs on to states. Program costs will rise as result, even as a relatively small number of students leave public schools for private education under universal choice.
Whether this new wave of expansive private school choice programs results in better educated students and increased social mobility is currently unknown—and may not be known absent transparency measures. What is clear is that policy design—including how to define “universal,” whether funding varies based on family income, and which private schools can receive funds—matters greatly in shaping the outcomes of universal private school choice programs. It will be important to continue asking questions about how equitably and effectively they serve the nation’s increasingly diverse student population and the return on investment they provide to state taxpayers.
Methodology
- This breakdown is based on 4,975 students listed in the Arkansas department of education’s first quarter report. By the end of the year, 5,404 students had received an ESA.
- The July 2023 data included 17,481 of the total 18,893 students approved.
- Based on data released from Step Up in September 2023 and does not reflect year-end totals. The 400 percent of the federal poverty level group also includes families who did not report income.
- This is accurate as of the initial program announcement. It is possible some awarded students ultimately declined the ESA, resulting in waitlisted students in different income brackets receiving the award instead.
- The Florida Department of Education provides quarterly reports with race and ethnicity data, but the latest reports are from 2022-23. Step Up for Students also publishes some racial information, but not across years.
- Ohio operates five voucher programs, four of which are targeted to specific populations, including special education students and those from low-performing public schools. The traditional EdChoice program, which serves students from low-performing schools, enrolls a higher percentage of Black and Hispanic students than public schools. However, this data focuses solely on who is eligible and participating after the universal expansion.
- The new cost estimates consider only students in grades 1-12 who are eligible under the universal program and did not previously attend a public school. The same average award amount used in the original calculations ($6,966) was applied here.