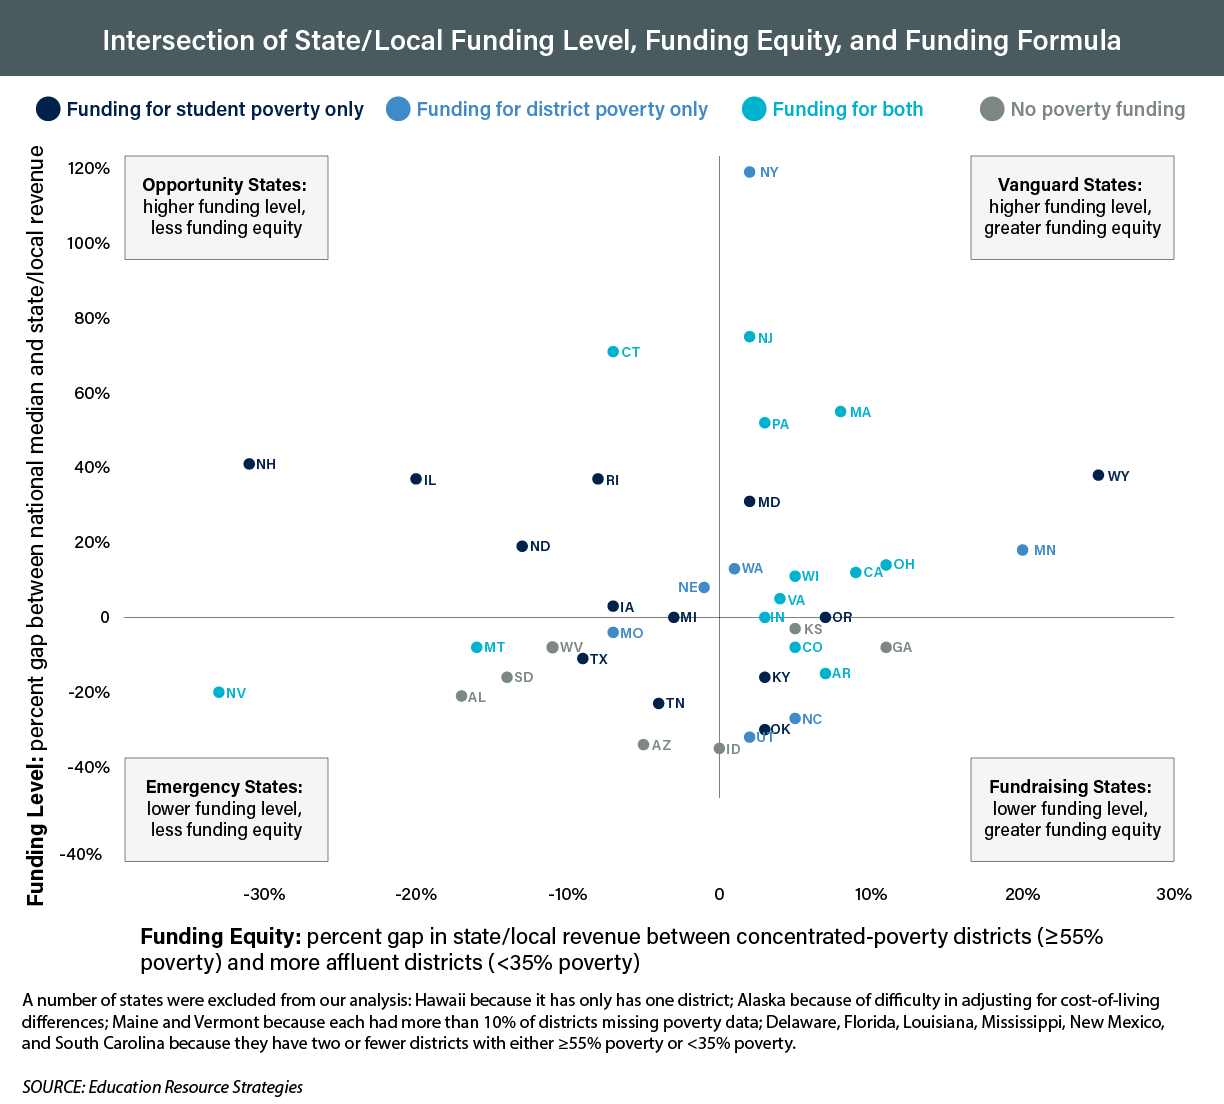
Methodology: We calculated each state’s average per pupil funding using each district’s geographically adjusted state and local revenue excluding capital and debt service (from the 2016-17 U.S. Census U.S. Census F-33 Public Elementary-Secondary Education Finance Survey, the most recent year available) and weighted for each district’s enrollment. We then found each state’s percentage gap from the national median per pupil funding level. To measure equity, we compared geographically-adjusted state and local revenue in districts with 55 percent or more of students eligible for free and reduced-price meals (from the Common Core of Data Public Elementary/Secondary School Universe Survey Data 2016-17) to that in districts with FRL-eligibility rates of 35 percent or less. We use percent of students qualifying for free and reduced-price meals—whether through traditional lunch program application or direct certification—because the majority of states that provide additional poverty funding use this in their formulas. Note: this analysis doesn’t control for other factors which may influence differences in revenue across districts, such as other types of student need (e.g. English learners or students with disabilities), or total district enrollment.
Explainer
