Educators and students are beginning to see where billions of dollars in federal Covid-relief aid to local school districts are going: new teachers and tutors, construction projects to repair ventilation systems and leaking roofs, and new textbooks and computer labs.
To determine how this unprecedented infusion of federal aid is going to be used, FutureEd spent several months analyzing local spending plans in a database compiled by the data-services firm Burbio. The 5,000 plans represent districts and charter organizations serving 74 percent of public school students and spending $83 billion of the federal Elementary and Secondary School Emergency Relief (ESSER III) aid flowing to K-12 schools.
While the plans can and will change, our findings provide early answers to six key questions.
1. What are the top priorities based on dollars designated?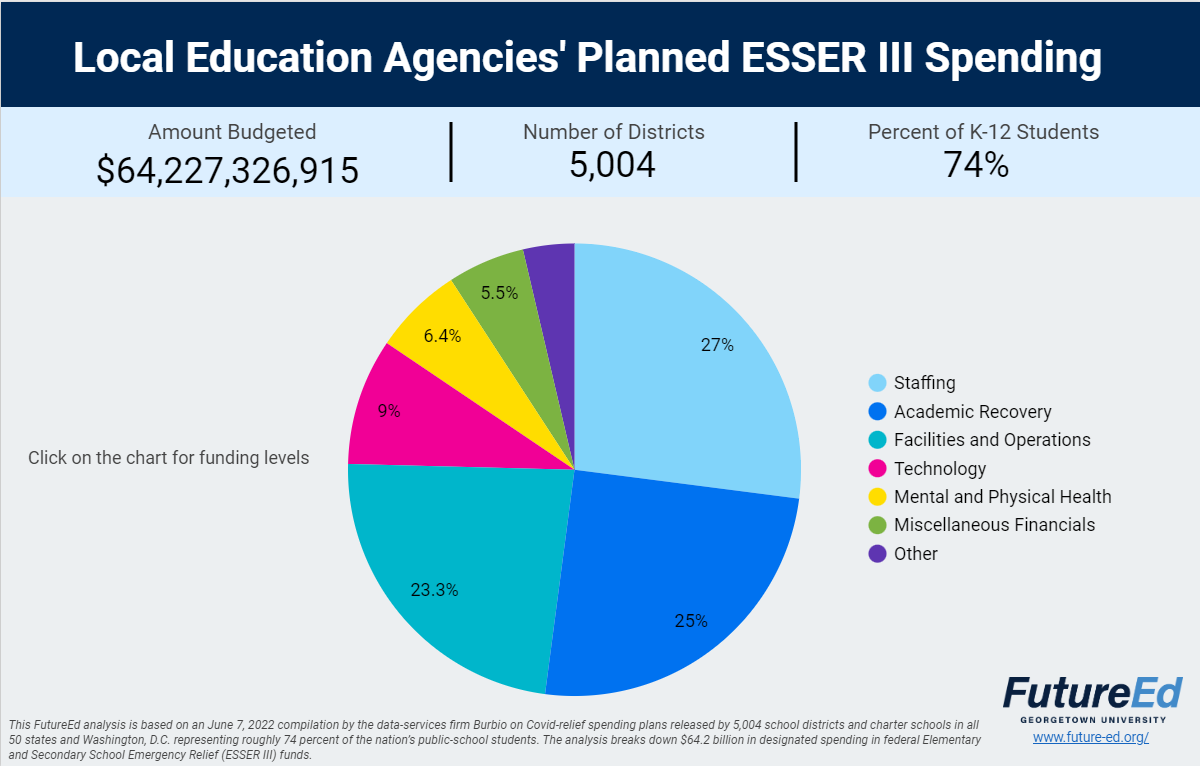
Our analysis shows that three priorities—staffing, academic recovery and facilities—account for more than 75 percent of planned spending. The analysis also provides dollar figures and projections for spending in key categories. Read the analysis
 2. What are the top priorities based on the number of districts?
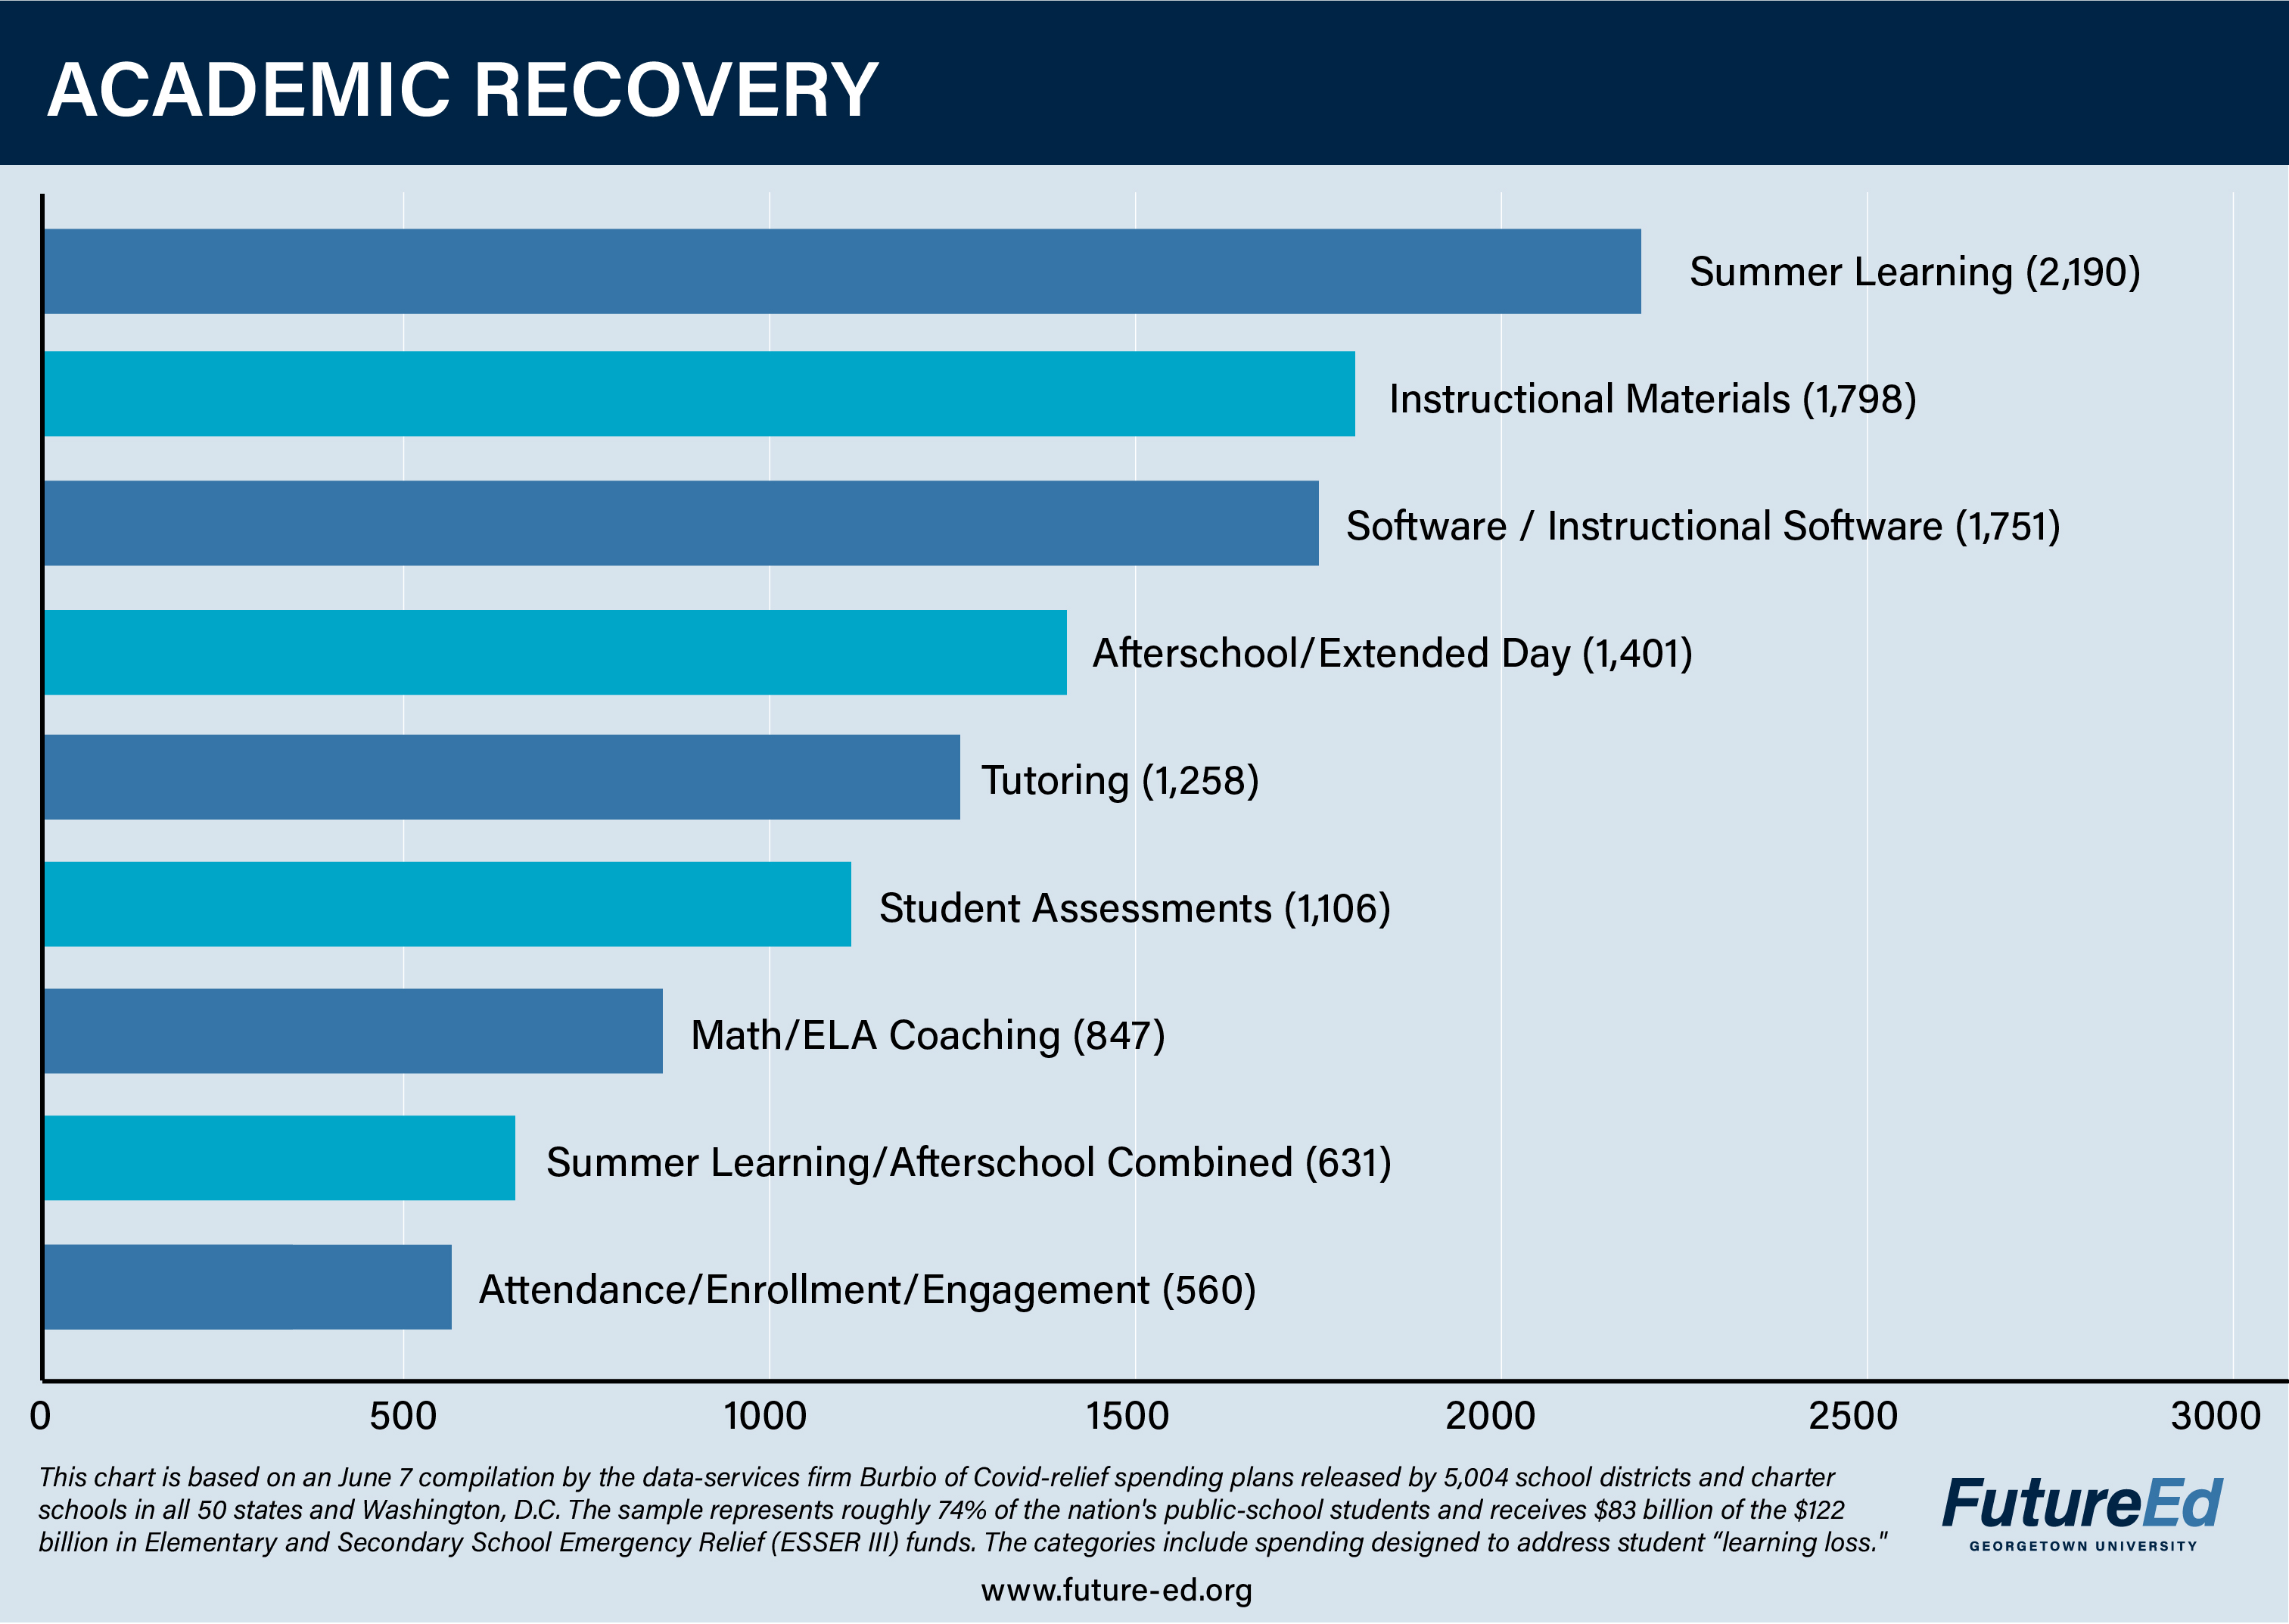
Hiring and rewarding teachers has consistently emerged as the most popular priority in district plans with HVAC updates and summer learning also appearing frequently. We divide the top priorities into five broad categories and provide a resource page for each. Read the analysis
 3. How do district poverty levels influence planned spending?
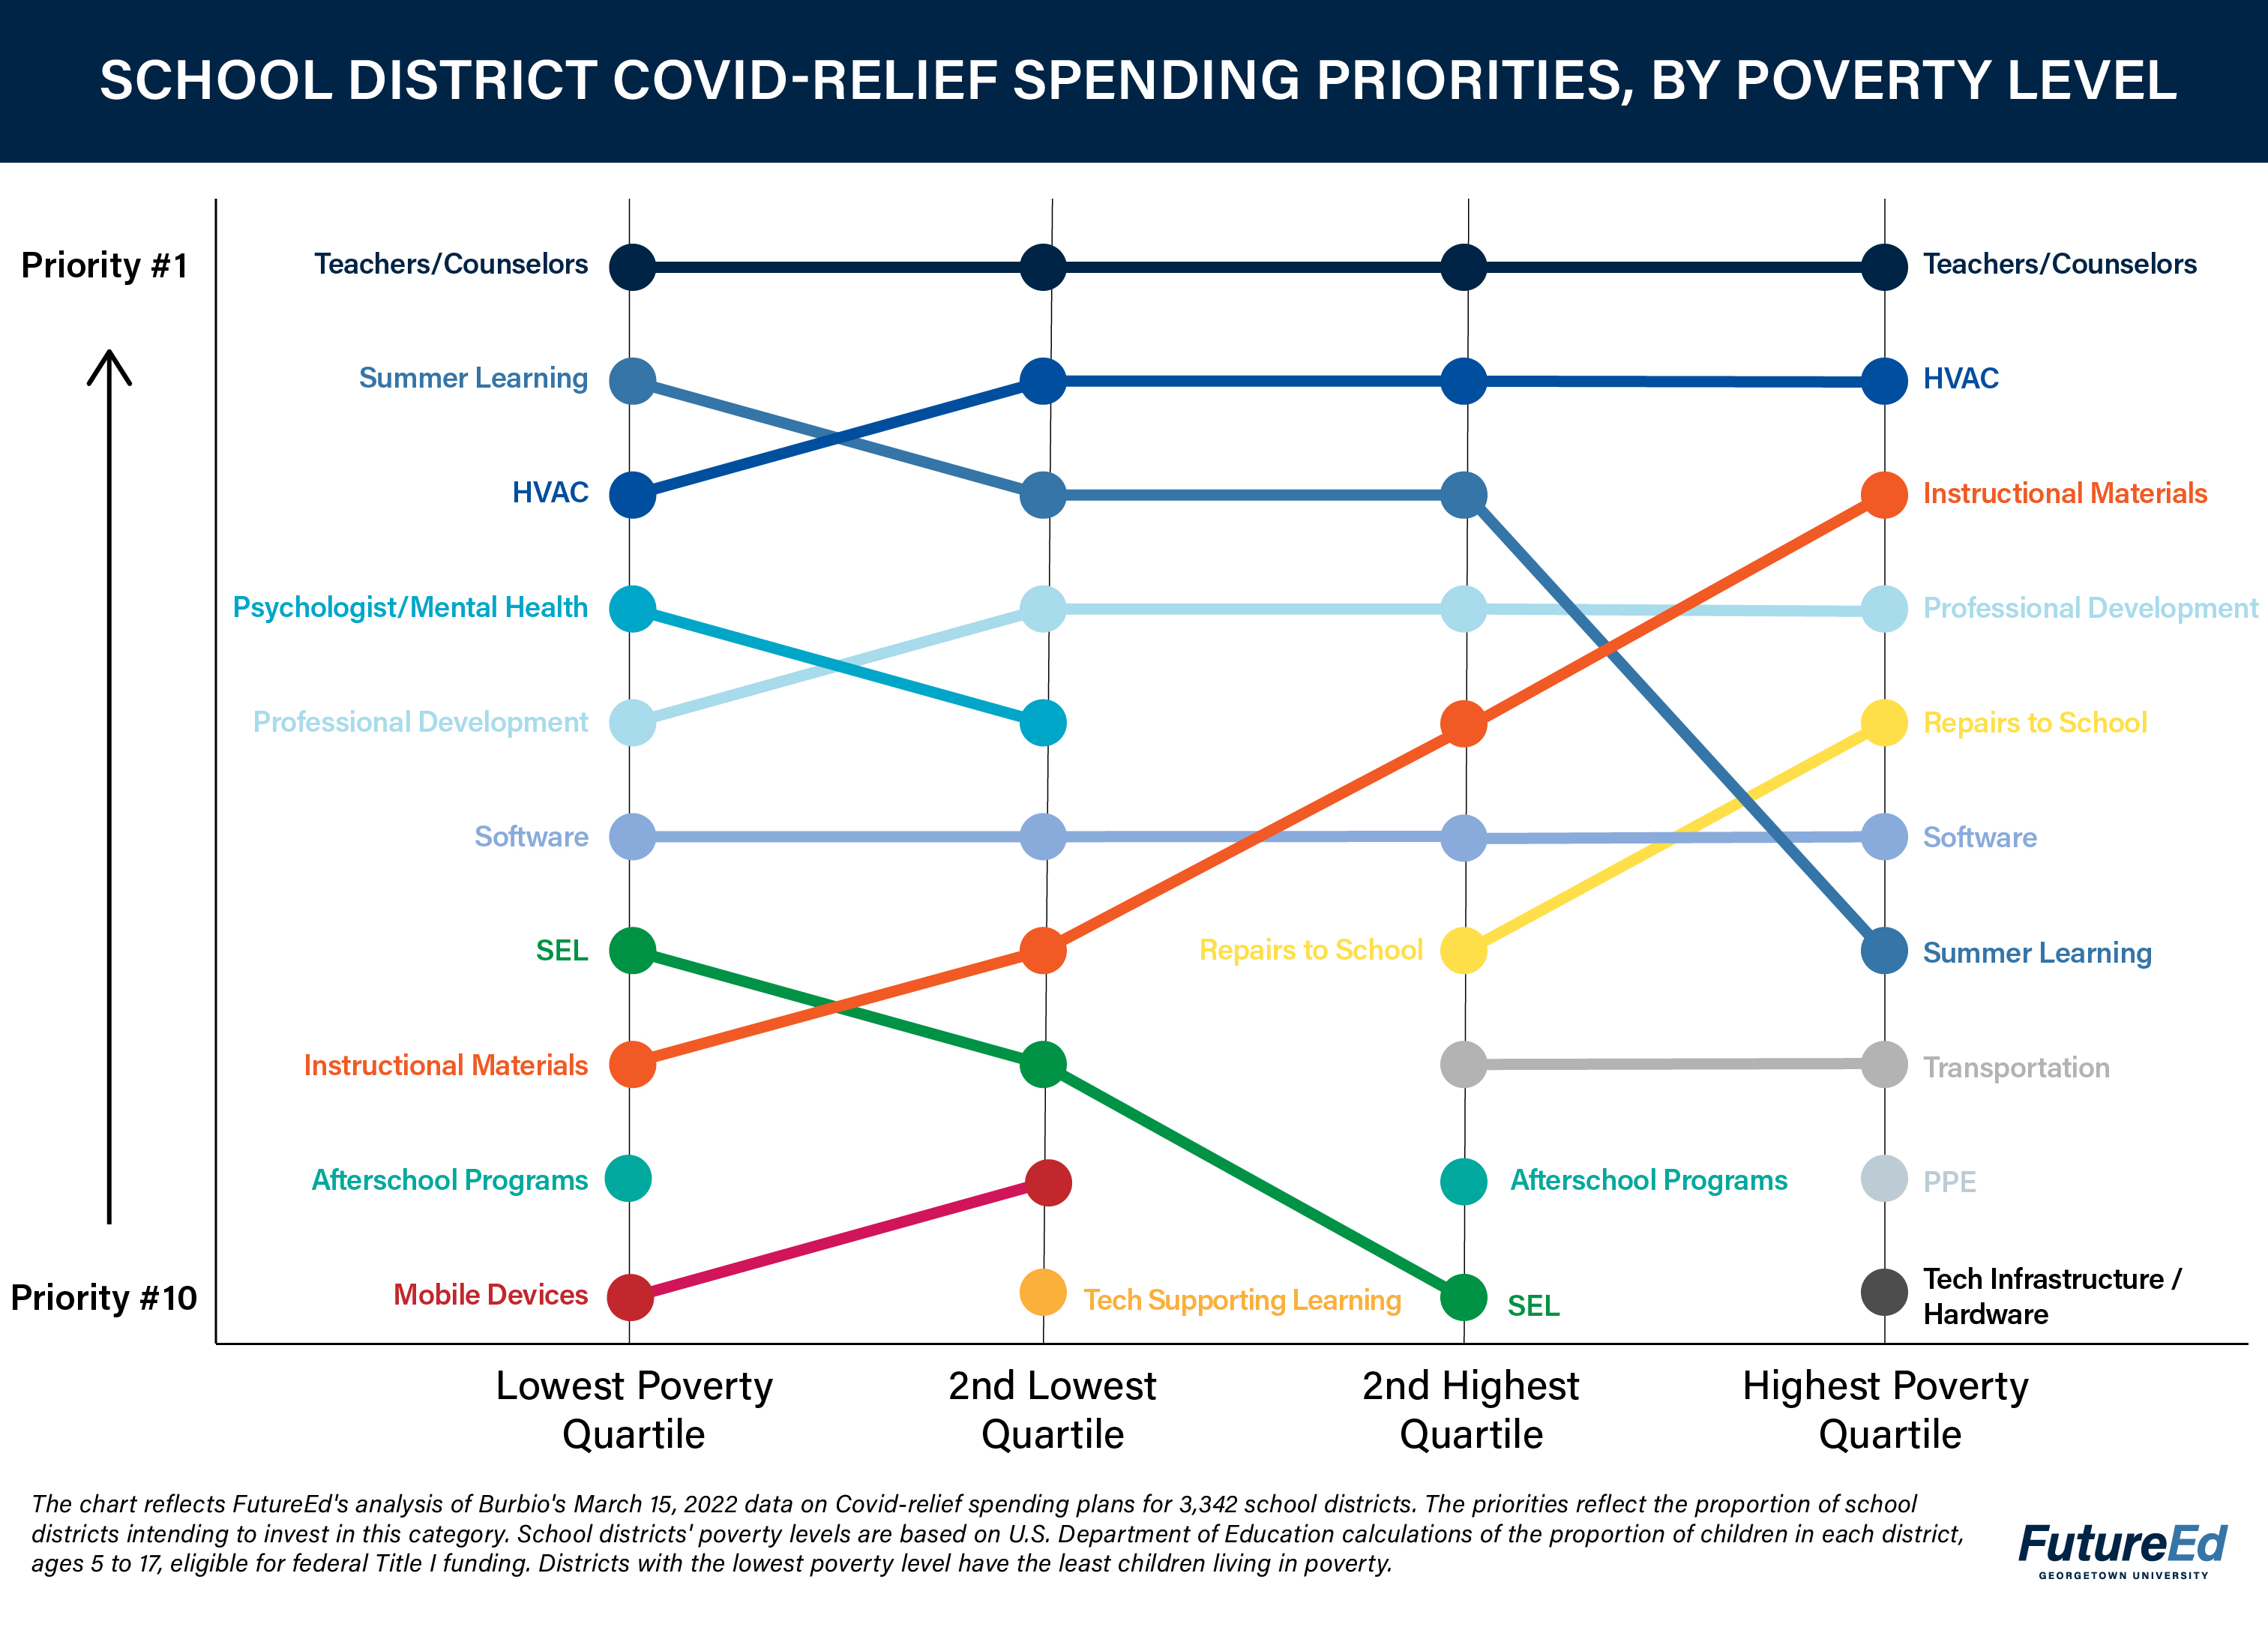
Districts with high rates of students living in poverty have far more ESSER money to spend—and are earmarking it for different priorities than more affluent places. In many cases—particularly instructional materials and HVAC repairs—districts plan to use the federal money to address longstanding needs. Read the analysis
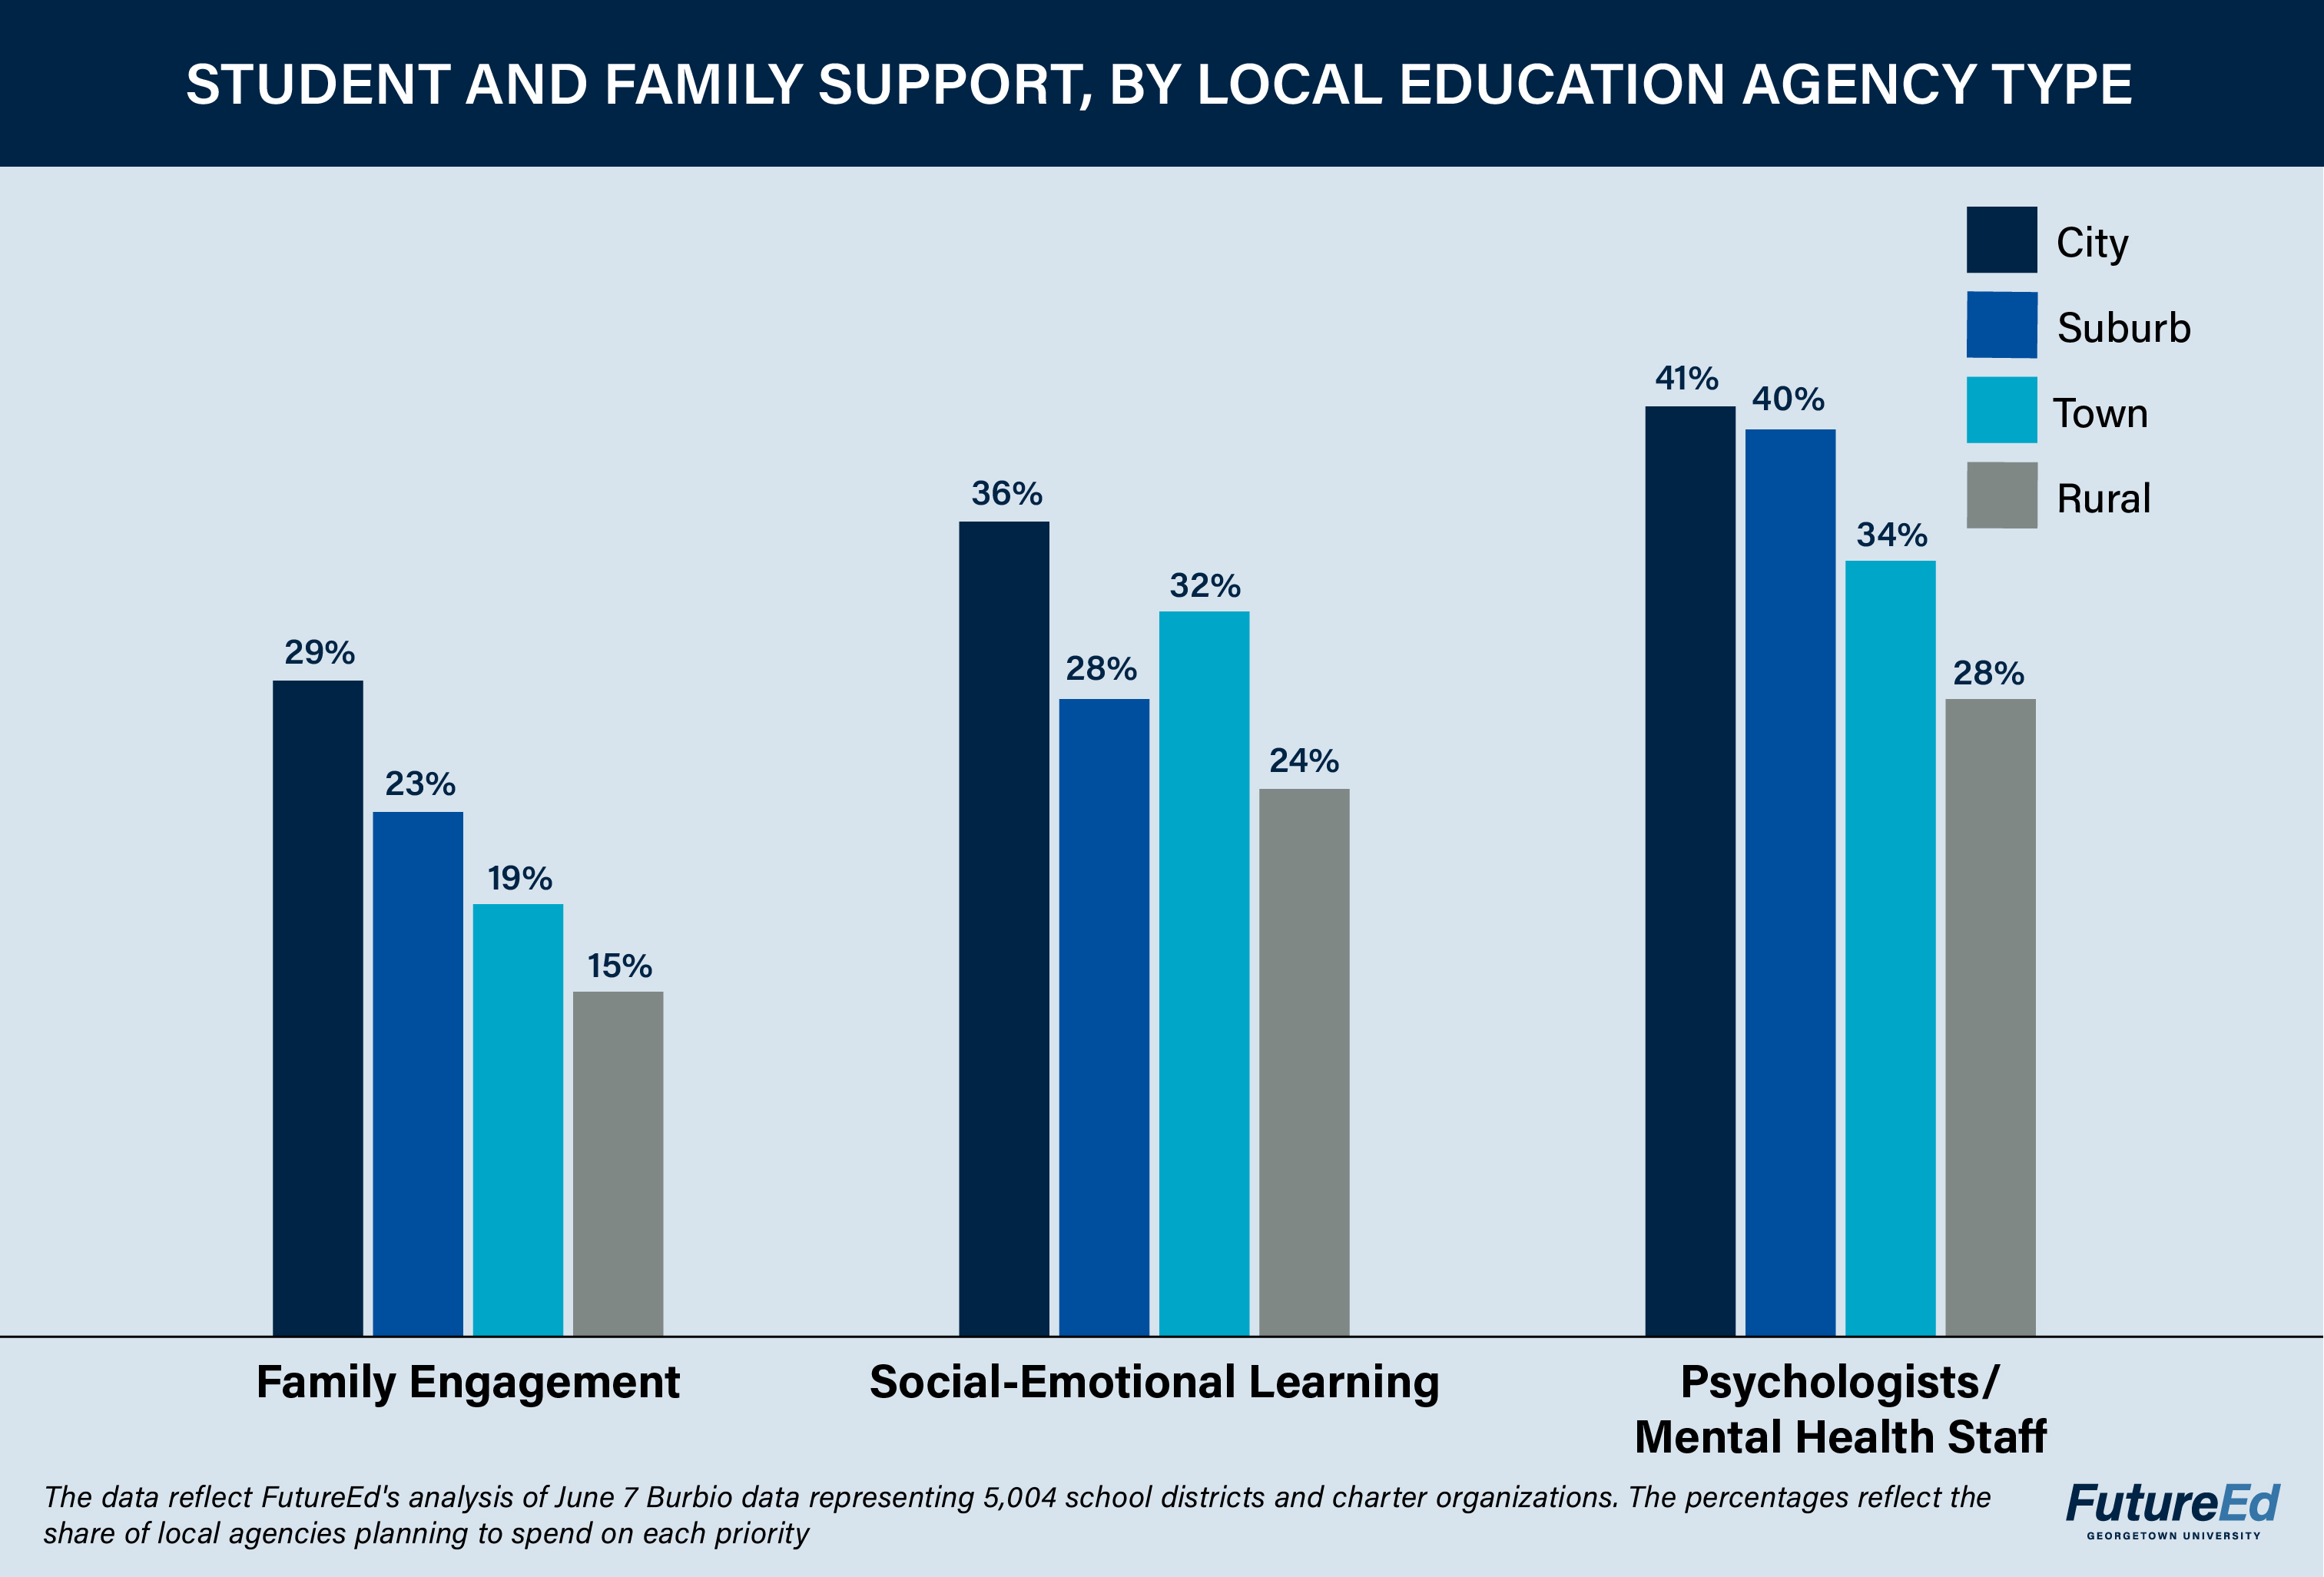 4. How do district settings—rural, town, city or suburban—affect planned spending?
The patterns we discern often reflect the realities of the varied geographic areas. Rural districts, for instance, are more likely to designate ESSER III dollars for transportation, while cities are more likely to spend on mental health workers and social-emotional learning. Read the analysis
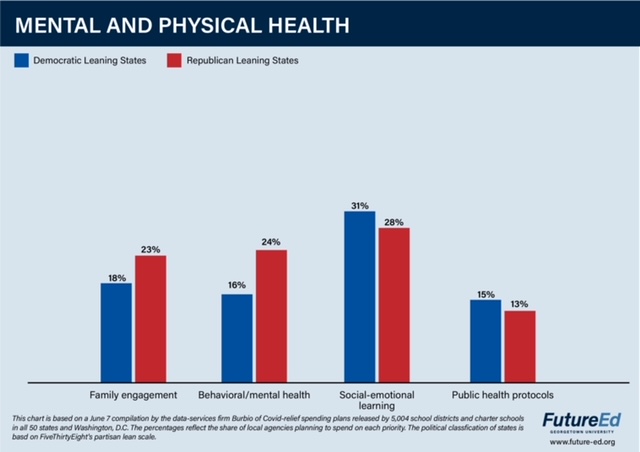 5. How does political partisanship influence planned spending?
Despite the divisive rhetoric around education, we found districts in red states and blue states have relatively similar priorities for their Covid-relief dollars. Nearly the same percentage have earmarked funds for social-emotional learning, tutoring, teacher training and new school infrastructure. Read the analysis
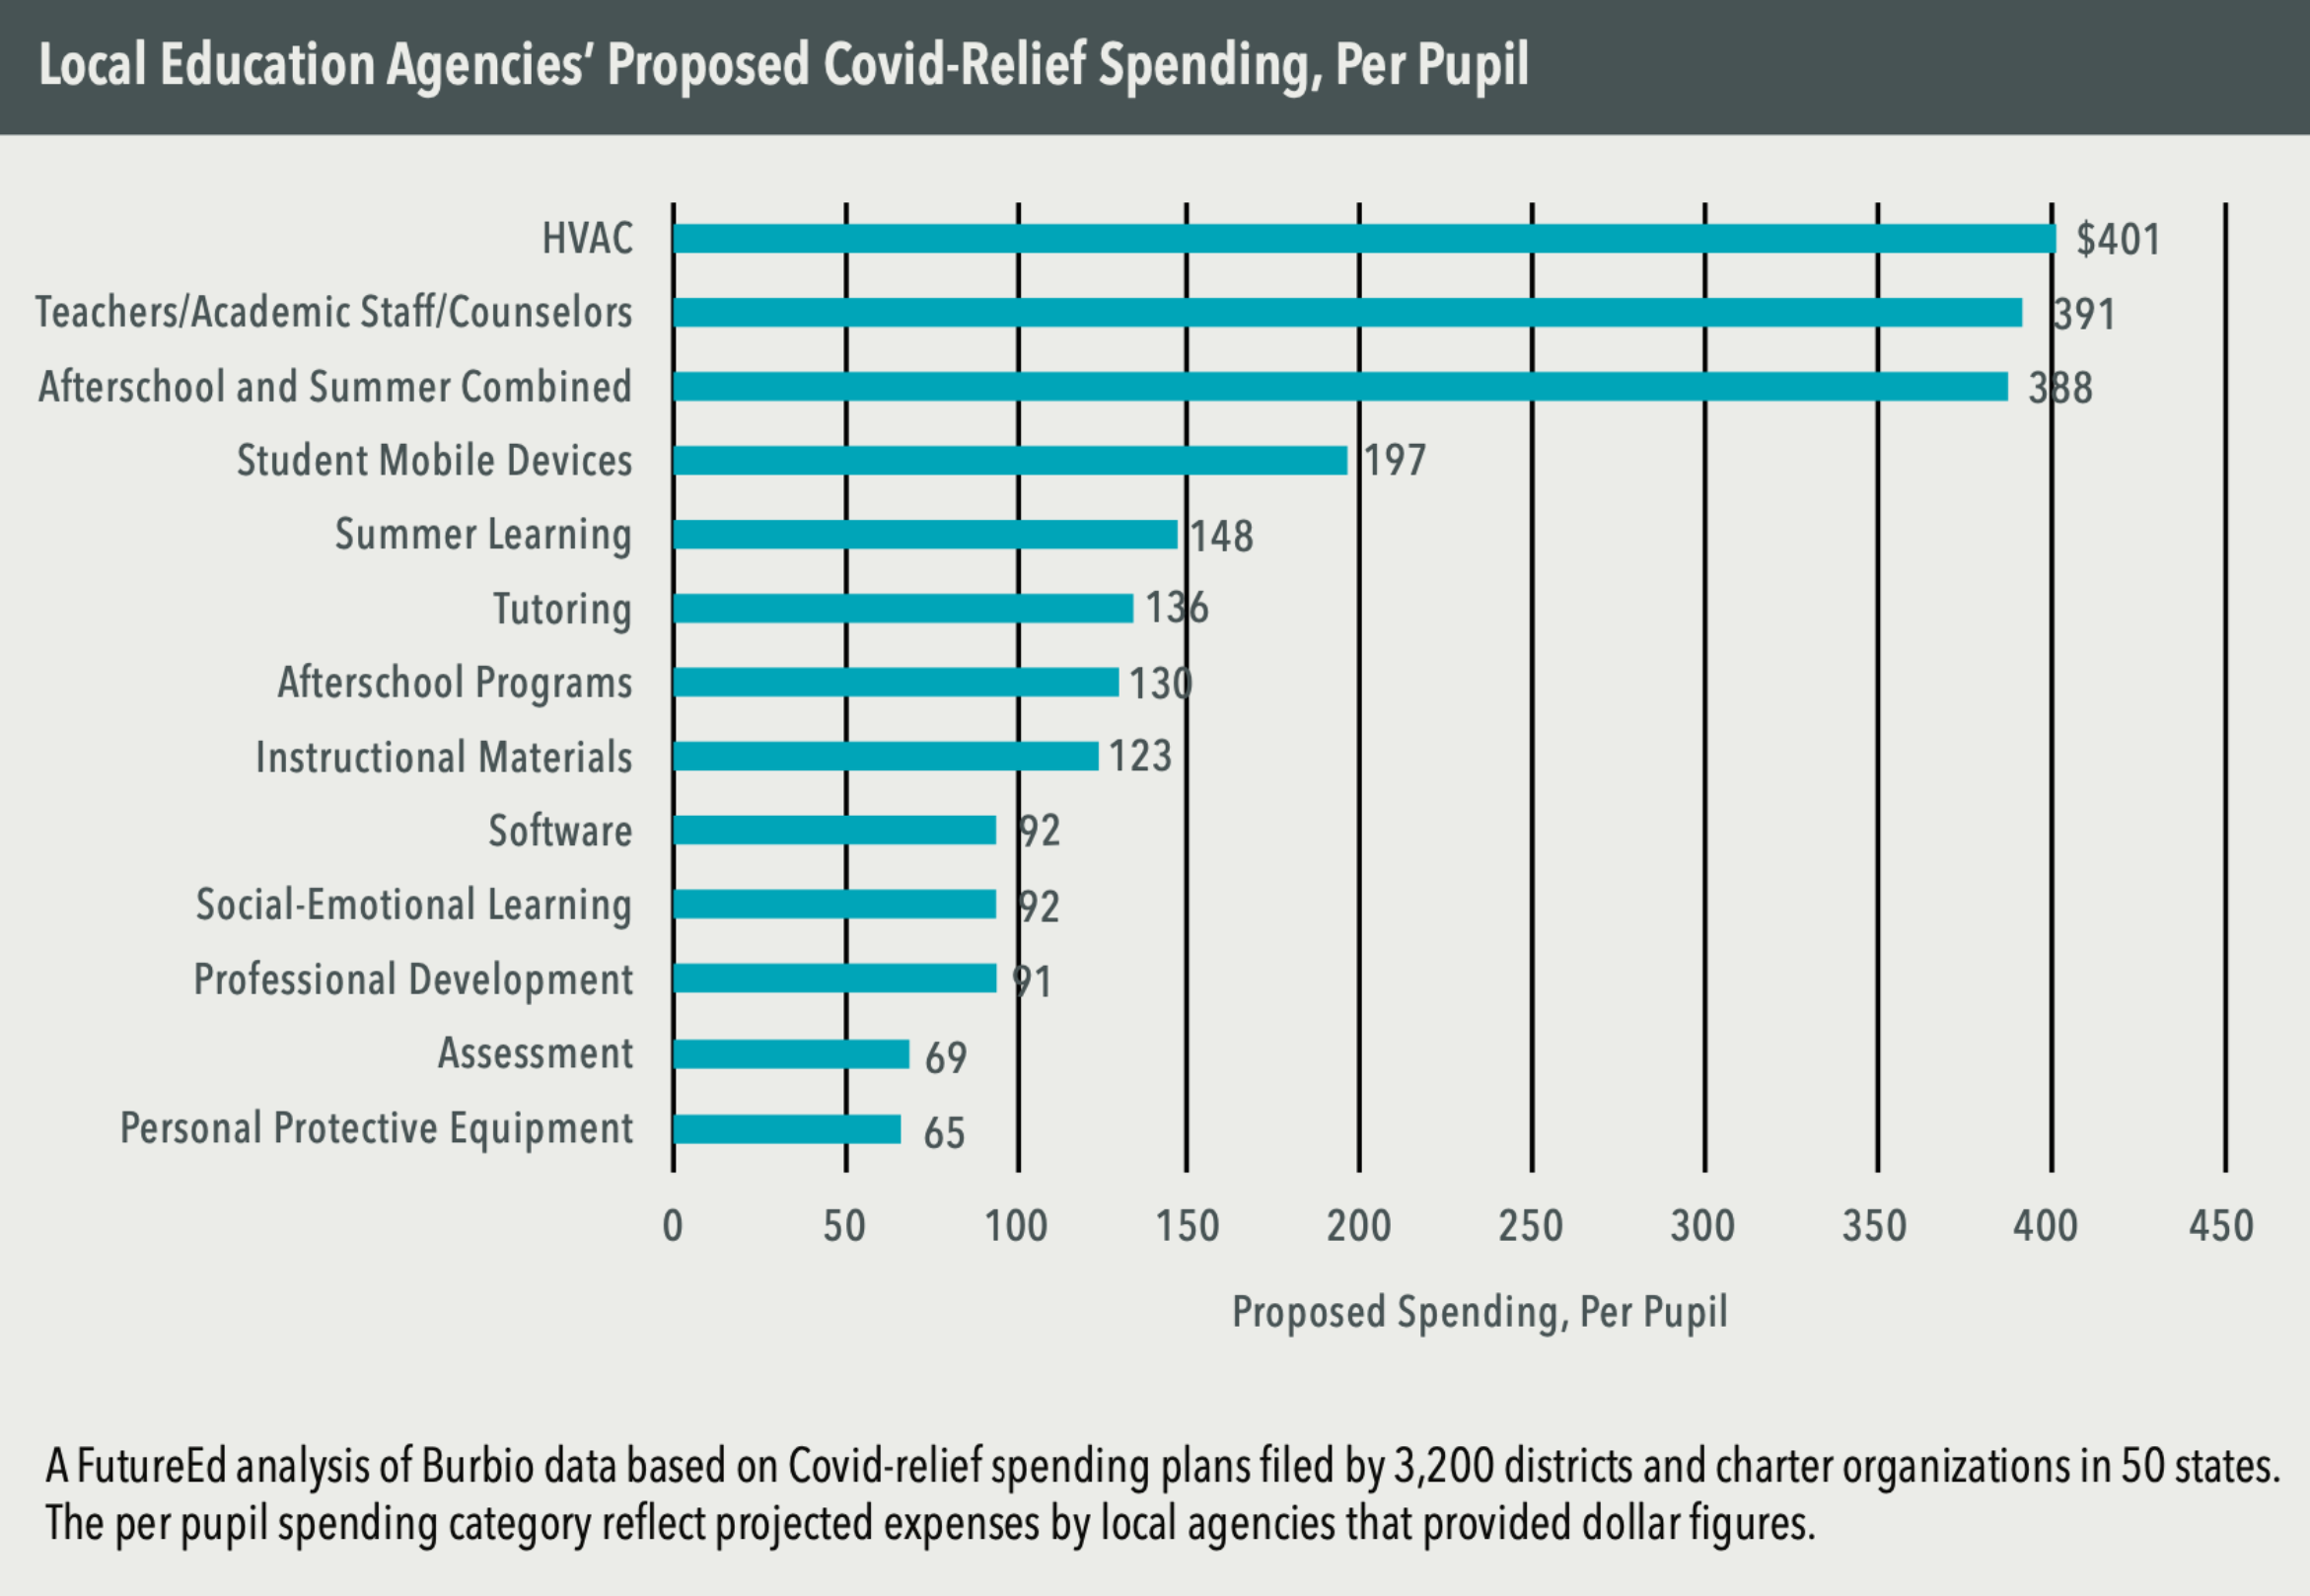 6. How does planned spending break down on a per-pupil basis?
Some educational priorities are simply more expensive than others. Hence, HVAC updates require the highest per-pupil expenditures in our analysis of expected costs, even though more districts plan to spend on hiring and rewarding academic staff. This piece also includes a regional breakdown of priorities. Read the analysis
In addition to answering these questions, FutureEd has researched how districts are spending on three key priorities, both using the Burbio data and our own review of plans for many of the largest school districts:
We also worked with two Connecticut nonprofit partners for a deep dive into a single state, using the state’s own grants database and comparing the findings to Burbio’s national numbers.